Technical analysis is the practice of using live data to predict future market moves. Usually, traders performing this type of analysis look at past data of the crypto coin in question, paying particular attention to statistics such as volume and price movements. This analysis involves using charting tools to look for patterns that indicate the strength or weakness of the cryptocurrency. These tools are similar to those used for other assets such as forex and stocks.
How technical analysis works
Market pricing, according to the Dow Jones theory, takes everything into account. Everything in the crypto world represents elements like current, future, and historical demand, trading expectations, regulations, trader knowledge of the cryptocurrency, and so on. Traders can use technical analysis to examine a price to determine the market sentiment it represents.
The basic idea behind this analysis is history will always repeat itself. The market sentiment at a certain price level will likely be the same when prices come back around to that level. With this, analysts can predict future price moves using market psychology.
Further, price movements are seldom random. Rather, prices tend to follow trends. When a coin’s price follows one trend, eventually, it will reverse to follow the opposite trend. In a nutshell, the technical analysis concentrates on the what of price movement rather than the why. It places its main focus on the forces of demand and supply.
How to read candlestick charts
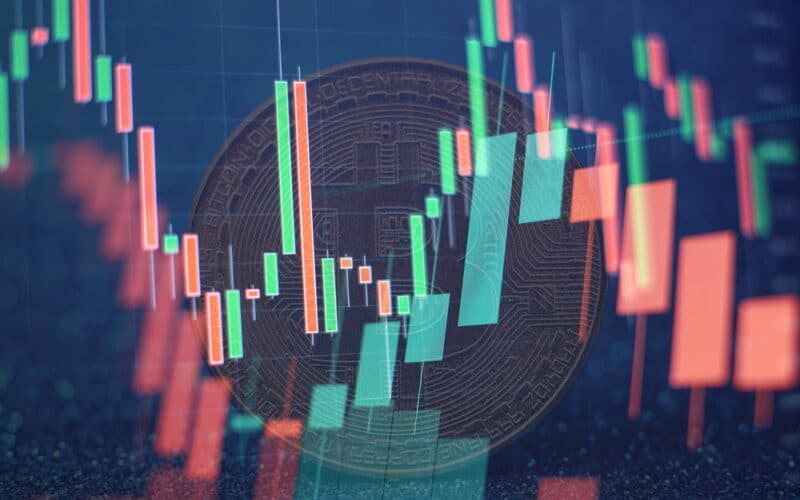
Candlestick charts are the most popular price charts for technical analysis. They are named after their appearance, where each plot point resembles a candlestick, with wicks at the top and bottom. The body of the candlestick is either colored red or green.
Red candlesticks indicate that price fell over that time period, and their body’s top and bottom represent the opening and closing prices, respectively. Green candlesticks mean that prices rose; thus, the top and bottom of their main body represent closing and opening prices.
Wicks are straight lines that emerge from the bottom and top of the candlestick. They represent the lowest and highest prices during the candlestick’s time period. Wicks indicate the market volatility during that period.
Trendlines
Trendlines are obtained by joining successive lows or highs of candlesticks. They indicate the direction of the cryptocurrency’s price movement. This movement can be upward, downwards, or even sideways. The trendlines help to point out the overarching trend in the midst of smaller highs and lows. A sideways trend shows that the coin in question has not made any significant price movements.
Support and resistance levels
A support level is a point at which most traders tend to buy the cryptocurrency in large quantities. These levels are marked by increased demand stemming from low prices. When prices approach this level, the increased demand tends to stop the declining trend or, in extreme cases, cause a trend reversal.
Resistance levels mark points of heavy supply coupled with reduced demand. At this level, traders feel that the coin is overpriced and desist from purchasing it. Uptrends tend to slow down when they approach this level or result in a reversal.
However, sometimes prices break out from support and resistance levels. This is usually an indication of the strengthening of the prevailing trend. If a previous resistance turns into a support level, the trend has even greater momentum. However, false breakouts sometimes occur, and one should be on the lookout for this before committing to a trade.
Trading volumes
A trend marked by high trading volume tends to have high momentum, and traders should pay close attention to such. Conversely, a trend accompanied by low trading volume is weak and will likely pass quickly.
Market cap
There are several crypto coins in the market today. Generally, the higher a coin’s market cap is, the more stable it tends to be. This market cap can be obtained by multiplying the total supply of the coin in circulation by its current price.
Relative Strength Index
This index is obtained using the formula:
100-(100/ (1-Relative Strength))
Where relative strength is the ratio of average days the coin was up to the average days it was down.
Usually, most charting platforms will provide the RSI indicator. This RSI ranges from 0-100. A score of below 30 indicates that the coin is currently undervalued and may soon increase in price. Conversely, an RSI of above 70 signifies the coin is overbought and may soon decline in price.
Moving Averages
In technical analysis, Moving Averages are vital in pointing out trends. Usually, they are obtained by calculating the coin’s average price over a specified period. Prices maintaining above a Moving Average denotes an uptrend. When prices trend below the Moving Average, it points to a downtrend.
Further, you can use several Moving Averages in one price chart, each being of a different length. Whenever the shorter-term MA crosses over its longer-term counterpart, it gives bullish signals. Alternatively, when the shorter-term MA crosses below the longer-term one, it gives off bearish signals.
Choosing the right time frame for technical analysis
Typically, the best timeframe for your analysis depends on your trading style. If you’re a day trader or short-term trader, you should opt for shorter timeframes. These could be 5 minutes, 15 or even 1 hour.
If you prefer long-term trading, keeping positions open for weeks, months, or longer, you should utilize longer timeframes. These could be daily or weekly charts.
Combining technical and fundamental analysis
Technical analysis is vital in forecasting future price trends, but it is less accurate when used alone. Economic news involving crypto, mining hash, and regulations are some of the factors that can affect a coin’s price. However, technical analysis does not take them into account. For this reason, it should be combined with fundamental analysis for the best results.
Conclusion
Technical analysis is a vital skill in cryptocurrency trading as it can give insights into future price movements. There are several indicators and tools on most charting platforms for performing this analysis. For best results, it should be used together with fundamental analysis.


