


On May 12, 2021, the 24-hour cryptocurrency trading volume surpassed the $237 billion mark. The high volume might have happened due to a sell-off that marked the end of a nearly year-long bull market but also indicated that the world was paying attention to the cryptocurrency market.
Retail traders can direct their attention to Bitcoin and the altcoins because of the efforts of several cryptocurrency exchanges. Binance exchange is the market’s most valuable crypto trading platform based on trading volume and weekly visits.
Indicators are indispensable tools when analyzing the market, and the exchange managed to climb to the market’s summit by incorporating special features such as Binance indicators.
However, you will quickly notice that there are myriads of Binance indicators from which you need just a few. How, then, do you know which indicators are best for trading? Read on to find out.
Binancemoku
Binancemoku is a modified Ichimoku cloud indicator. The Ichimoku Cloud indicator is a collection of Moving Averages – 9, 26, and 52-period moving averages. All the moving averages translate into an equilibrium chart that gives you an idea of Bitcoin or altcoin price trends with one look.
A TradingView user called scarf wrote the script for Binancemoku. Instead of the default 9, 26, and 52-period moving averages, scarf adjusted them to 7, 25, and 99 – called Binance Moving Averages.
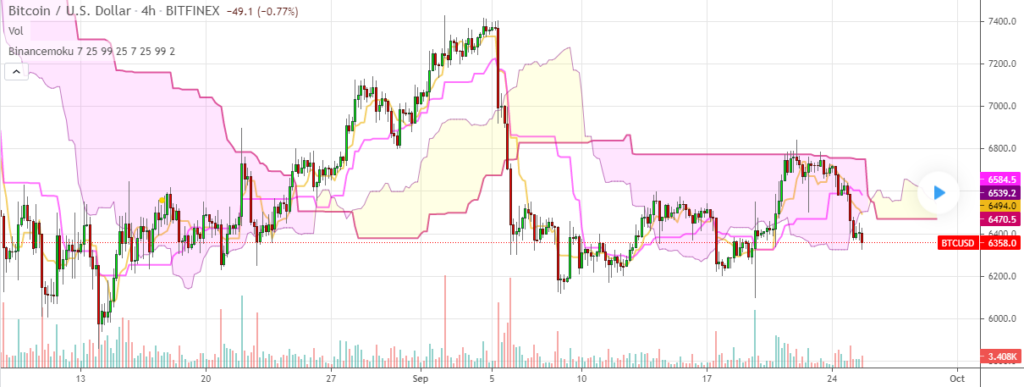
Figure 1: Binancemoku on a 4-hour BTCUSD chart
Binancemoku’s working principle is similar to the Ichimoku cloud. Chartists can identify the trend in the current Bitcoin price, or even altcoin prices, as well as potential trading signals by studying the position of Leading Span A and Leading Span B lines. These two lines enclose the Binancemoku cloud.
Binance Moving Averages
Moving averages are the foundation of technical analysis, whether you analyze a stock market chart or cryptocurrency prices. In technical analysis, Moving Averages have a simple goal – to use existing price data to anticipate future price directions better.
Using Moving Averages in stock charts helps traders to determine the strength in the current price trend of a given stock. In the cryptocurrency market, Moving Averages help traders confirm trading signals, such as whether the time is right to buy Bitcoin to USD.
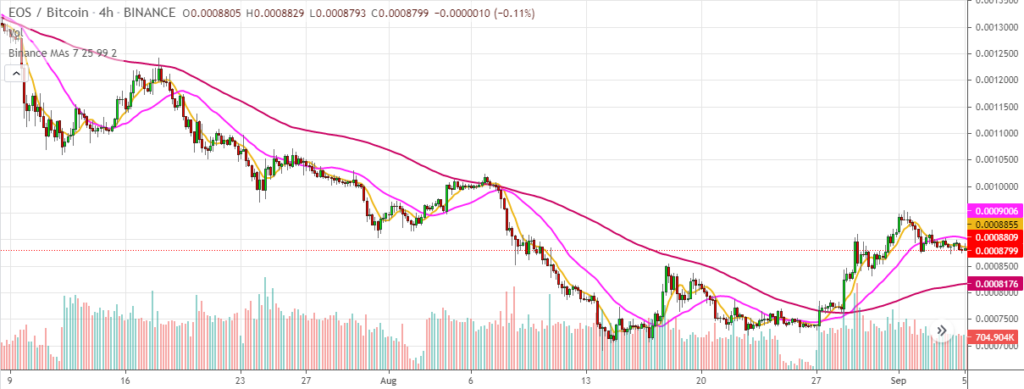
Figure 2: Binance Moving Averages on EOSBTC 4-hour chart
Binance Moving Averages are similar in concept and operation. 50, 100, and 200-period Moving Averages are common within traditional markets. Traders read the 50-day and the 200-day MAs as the bottom and upper extremes, respectively. Binance Moving Averages differ from the traditional MAs in that the default periods are 7, 25, and 99 days.
Binance BTC ALT Ratio Difference [BigBitsIO]
Investors often face a hard choice when the time comes to select what indicators to use for trading cryptocurrencies. The reason for this is many indicators are too technical to understand, and others do not work. That is why some experts opt to create robust yet straightforward indicators such as the Binance BTC Alt Ratio Difference.
Granted, the name itself is a mouthful, but you shouldn’t be scared because the indicator is easy to understand. Developed by a TradingView user named BigBitsIO, the script helps traders to make better decisions when trading Bitcoin (BTC).
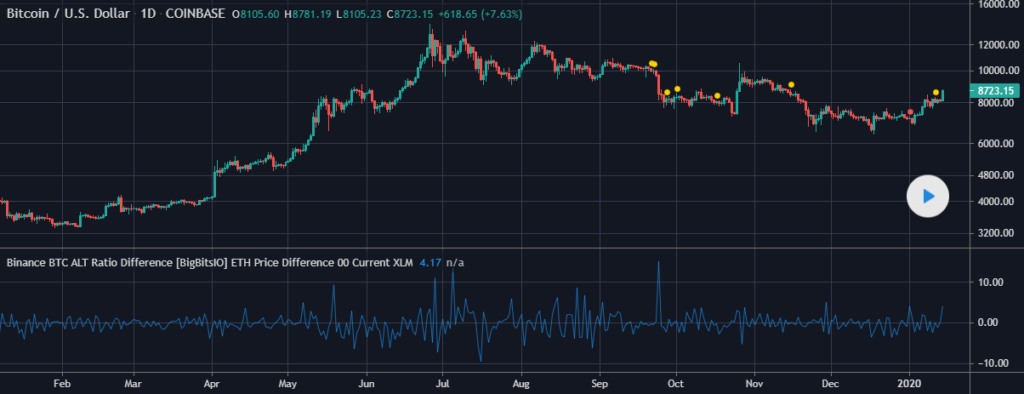
Figure 3: Binance BTC Alt Ratio Difference
The script computes the relative BTC and Tether (USDT) prices then compares them to relative altcoin prices. The script divides the given altcoin price with USDT price, then divides the result with the dividend of the altcoin price and BTC price.
Ultimately, the script aims to determine whether the altcoin is trading high or low compared to bitcoin’s relative price.
Libertus – MA and EMA setups by Binance
We saw earlier that Moving Averages (MAs) underlie technical analysis since long ago. Take a look at stock charts – MAs build the foundation of key indicators. The same is true within currency exchange markets.
Now, there is a more sophisticated iteration of MAs called Exponential Moving Average or EMA. While MA is simplistic, it only computes an average of historical crypto price data, and EMA determines the trend in the price data and its direction over time. In other words, EMA is more thorough when munging price data, and it puts more emphasis on recent data.
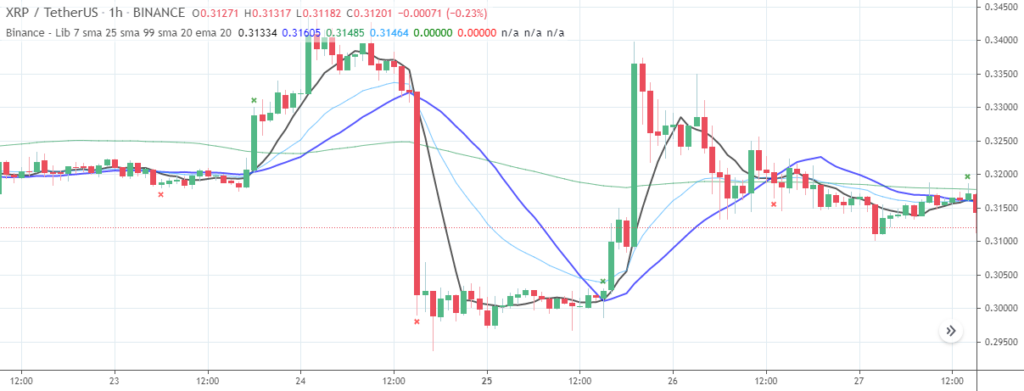
Figure 4: MA&EMA – Libertus – Binance setup
The MA&EMA Binance setup, developed by a TradingView user named Libertus, combines the two concepts into one indicator. The MA setup is the typical Binance Moving Average with the default periods of 7, 25, and 99. On the other hand, the EMA setup uses a length of 20 days. The setup is ideal for trading altcoins.
Binance BTCUSDT Tether adjusted
High volatility is one of the biggest challenges that cryptocurrency traders face. The frequency at which prices shift could be scary to some. That is why a TradingView user called NeoButane created the Binance BTCUSDT Tether Adjusted indicator to generate a semblance of stability.
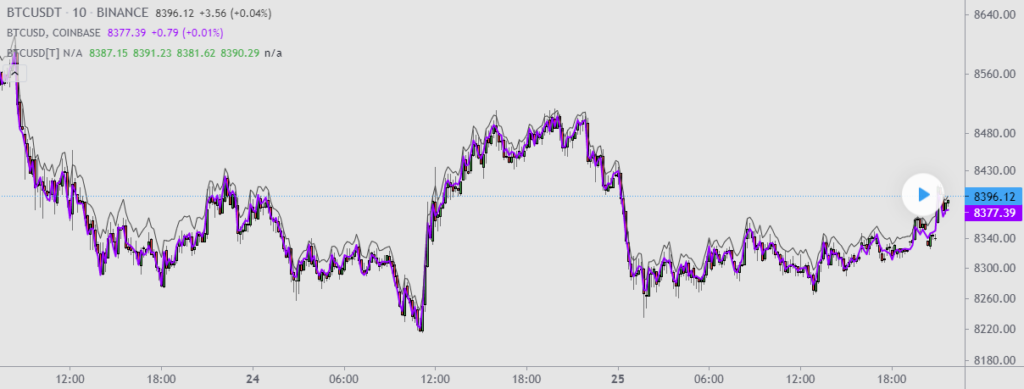
Figure 5: Binance BTCUSDT Tether Adjusted
Say you wish to buy BTC to USD. If the price of the USDBTC ticker can’t remain stable, you are likely to put off making the transaction for fear of suffering unintended losses. The only way you will be confident enough to make the trade is when you know the pair’s price will remain the same when your order is executed.
Binance BTCUSDT Tether Adjusted helps to achieve price stability. The indicator generates a BTCUSDT price level that better reflects the spot exchange price. Even better, adding the Binance MA to work alongside this indicator generates more accurate trading signals.
TRI BINANCE SH1TCOINS U500S
How about a unique indicator that targets less-talked-about altcoins? For starters, Binance is the world’s largest cryptocurrency exchange on multiple fronts. The platform lists thousands of crypto pairs, including shitcoins.
Shitcoin is the name given to altcoins that seem to serve no particular purpose or whose intrinsic value is indiscernible. However, this description is mainly subjective. Some people might see value where others see a joke; a good example is Dogecoin.
The TRI BINANCE SH1TCOINS U500S is a unique setup that incorporates the Binance Moving Average, the EMA, and the Moving Average Convergence Divergence (MACD) indicators to identify trends in the price action of shitcoin pairs.
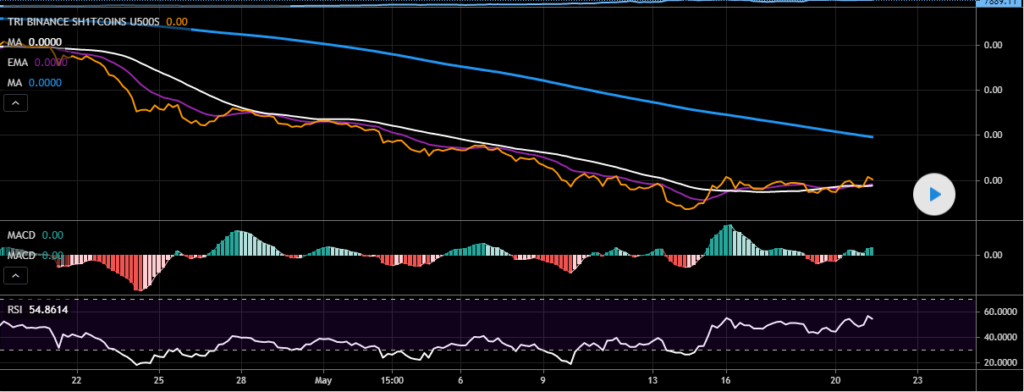
Figure 6: TRI BINANCE SH1TCOINS U500S
I say unique because most of the indicators in the market today prioritize the price action of Bitcoin and other major altcoins such as Ethereum (ETH).
Binance TRX & BTT
Binance TRX & BTT specifically targets the Tron (TRX) and BitTorrent Token (BTT) markets. NeoButane, a TradingView user, created the indicator to generate the actual value of TRX and BTT, especially in the event of new airdrops.
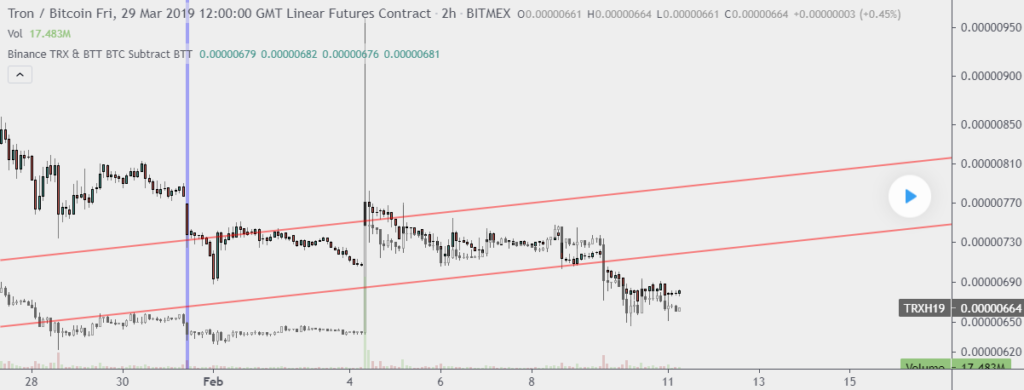
Figure 7: Binance TRX & BTT
NeoButane earlier noticed that TRX futures prices tend to differ from the TRX spot price during an airdrop. The difference is often confusing, especially to beginner traders, which could lead to bad trades. The script aims to match TRX/BTT futures with TRX/BTT on specific crypto exchanges, including Binance and BitMEX.
Matching the spot price with the futures price enables traders to get a clear sense of their bearing when considering trades.
Conclusion
Cryptocurrency trading might be a new adventure, but the underlying concept is old. For instance, most of the indicators used in traditional markets are relevant when analyzing crypto pairs.
Recognizing that cryptos are a unique space, Binance created a platform that gives users a free hand to try new techniques to generate higher returns. So far, users have developed several scripts that provide experts and newbies with an equal chance of making profitable trades.
In short, cryptocurrency trading is now easier because you can find the right indicator for whatever strategy you choose to deploy.