


Elon Musk’s tweets have been the driving force behind price action activity in the cryptocurrency market for a while now. Extreme levels of volatility have become the order of the day with every tweet, touching on digital currencies by the Tesla CEO. For fundamentalists, the tweets have been the weapon of choice for entering and exiting trades. However, some traders have made a fortune by relying on technical analysis to determine ideal entry and exit points.
As is the case in the mainstream financial system, it is also possible to profit from being a fundamental or a technical trader in the burgeoning crypto market. Investors have various tools that fit their unique play style and pay close attention to Musk’s tweets and rhetoric about digital currencies prospects.
That said, what is the best indicator for crypto trading? People use different tools to gain insight into the direction various cryptocurrencies are likely to change. Such tools make it easy to identify patterns and spot ideal places to buy and sell while considering the rhetoric by market forces such as Musk.
Below are some of the most popular technical analysis tools.
Relative Strength Indicator
Given the heightened levels of volatility in the cryptocurrency sector, it is important to know the status of momentum before opening a trade. The Relative Strength Index would be ideal to understand whether a coin is overbought or oversold.
It measures the magnitude of price changes with the data displayed as an oscillator with values of between 0 to 100. Whenever the momentum increases while the price is also rising, the tool reading will also increase, beckoning bullish impetus. Similarly, if the drive grows while decreasing, the RSI will also trend lower, hinting at a bearish push.
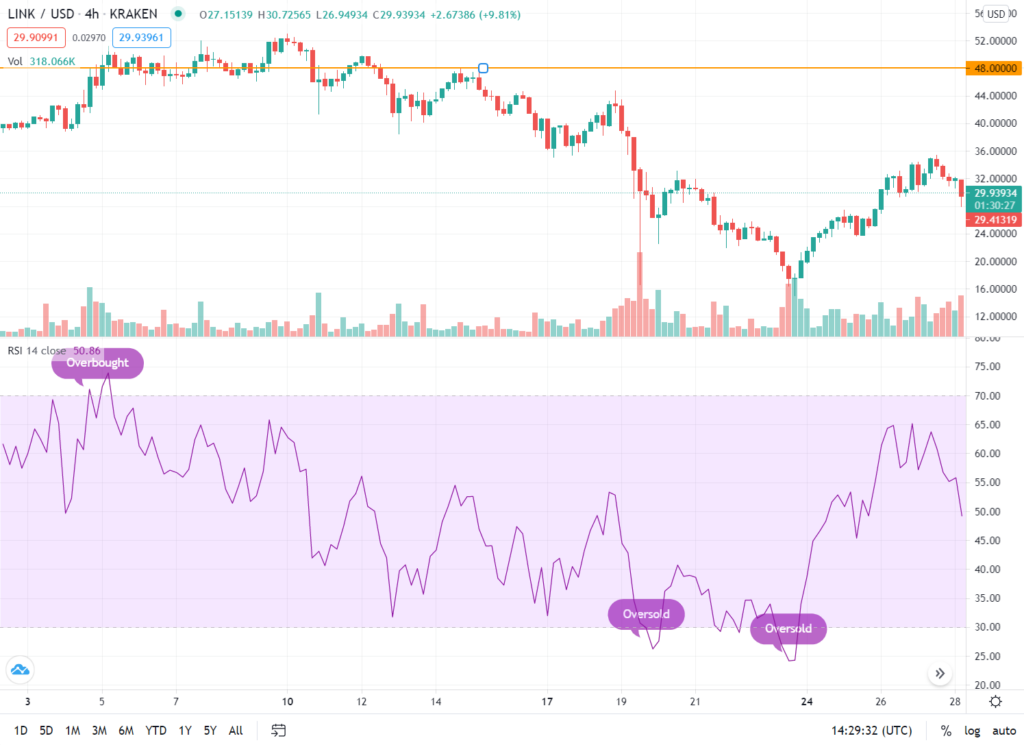
In the chart above, as soon as the price rose to the $48.000 level on May 4, 2021, the RSI was way above the 70 level, signaling overbought conditions. What followed next was a significant pullback, with LINK/USD dropping to the $46.93742 level the following day, where oversold conditions came knocking, resulting in another correction higher.
From the chart above, it is clear that a lower correction often comes into play whenever the RSI reading is above 70 or close to. Similarly, price tanking to the extent the RSI reading is below 30 as when the price dropped to $15 on May 24, 2021, results in a bounce-back higher.
Moving Average
A moving average is an indicator that allows crypto traders to filter out the noise and know the direction of the underlying crypto trend. It is based on past data, thus the lagging notion. The longer the period used, the greater the lag and the more effective the MA. For instance, a 200-period MA will react slower to changes than a 20- or 50-period MA.
While trading cryptocurrencies, people use MA to gauge the current trend. Likewise, whenever the price is above the 200-period MA, one would look to enter a long position. Similarly, a trader would look to enter a short position when cryptocurrencies are trading below the 200-period MA as the asset is in a downtrend. However, most traders choose to combine 2-3 MA making the trend more obvious.
For example, whenever the 50 MA crosses below the 200 MA, it is time to sell the asset you have been holding or short. The 50-period MA crossing 200 MA can be interpreted as a buy signal, indicating the coin is likely to rise. Whenever such a crossover is preceded by positive sentiment from Elon Musk on a given coin such as Bitcoin or Dogecoin, it implies a strong buy signal.
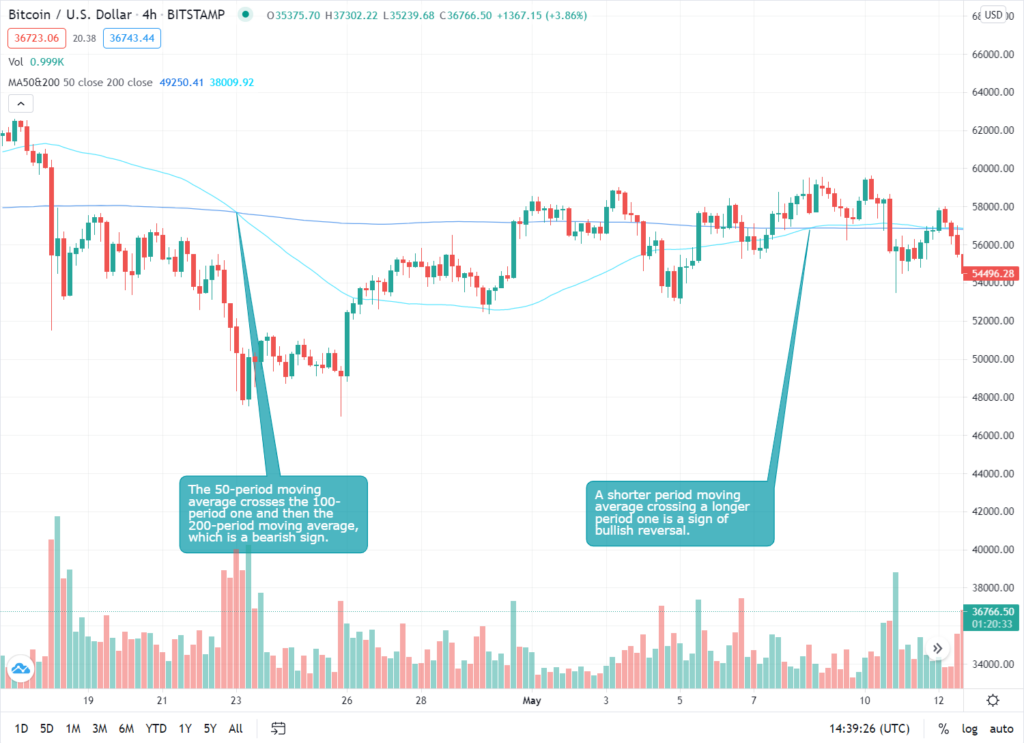
From the chart above, we can see a clear indication of a downtrend on April 23, 2021. While there were support attempts around the level of $53,000 on April 30 and May 5, the MAs did not confirm the reversal until May 12, 2021. However, when it happened, it was short-lived and did not last on the low transaction volume.
As you can also observe from the Bitcoin chart above, using the moving averages, a trader would receive buy and sell signals after the actual price setup, meaning that this indicator is laggard and works better for backtesting than prediction.
Moving Averages Convergence Divergence
A MACD indicator offers a warning sign whenever reversal is about to happen. It hints at drive shift by showing the relationship between MA’s. For instance, if Bitcoin or any other cryptocurrency is making higher highs while the MACD is making lower highs, it should be a warning sign that the drive is shifting and that the coin could soon correct its price.
Additionally, it provides entry and exit points confirmation. For example, if the MACD line crosses above the signal line, the same could hint the price is about to jump, therefore, a buy sign. Conversely, if the MACD line crosses the signal line and drops, that could be a sell hint.
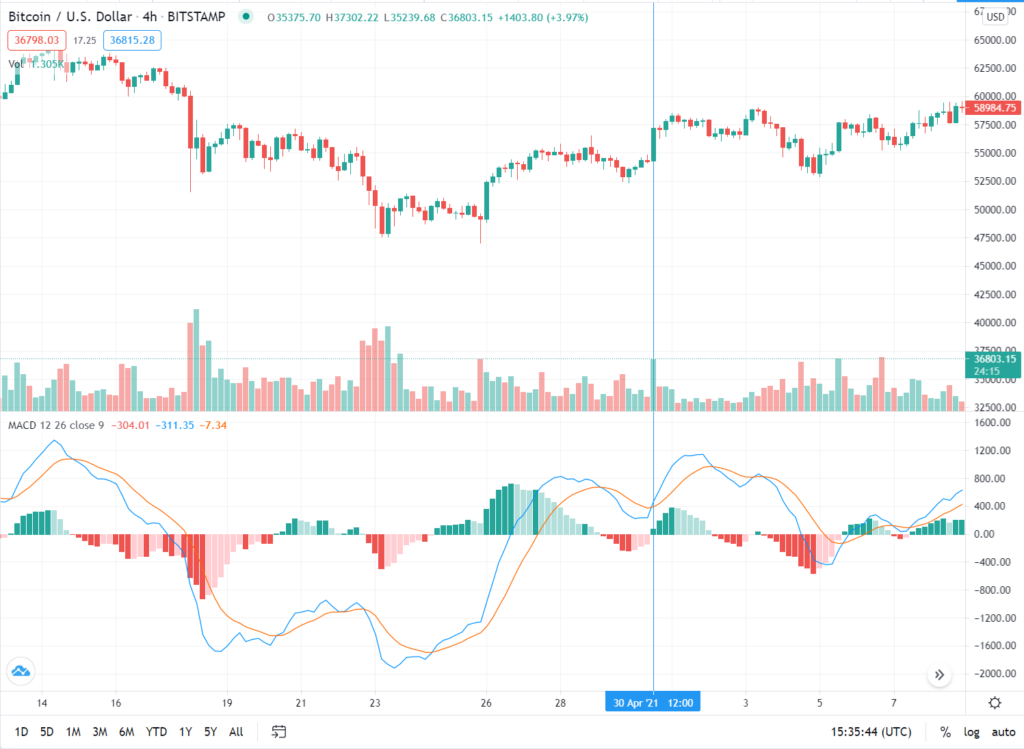
In the chart above, the fast-moving average on the MACD indicator designated by the blue line crossed the slower moving orange one signaling bullish momentum. Consequently, the Bitcoin price rose to the highs of $37,302.22 on April 30, 2021. The prices continued to edge higher until May 2. After that, however, the MACD indicator edged lower, signaling the momentum shift.
Stochastic
Stochastic shares the same attributes as RSI as it reflects momentum shift. Extreme levels of volatility often cause overbought and oversold conditions on traders reacting to various developments, such as sentiments echoed by Musk about some cryptocurrencies.
The stochastic values range between 0 and 100—readings of below 20 hint at oversold conditions. While a digital currency can remain in oversold conditions for the longest time, this indicator can also act as a warning sign as a reversal could come into play.
Alternatively, whenever the stochastic readings are above 80, the same hints overbought conditions signaling it could correct and tanks. In the chart above, you can see the indicator crossing the oversold level on May 24, 2021, right before the reversal, offering an excellent opportunity to sell the BTC/USD pair.
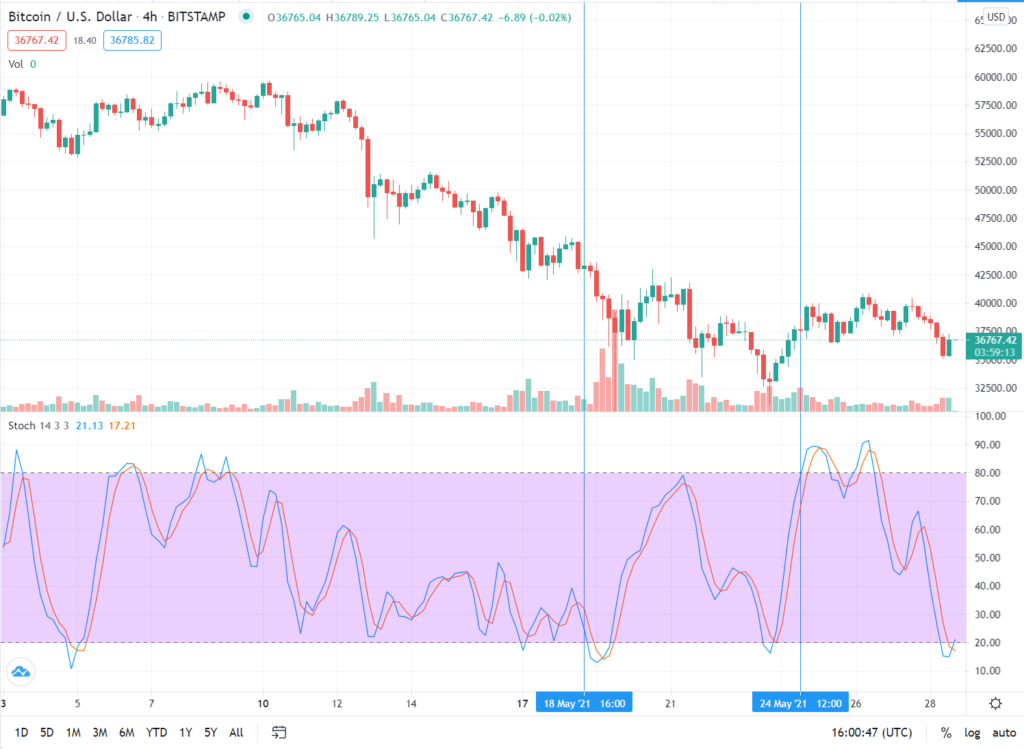
The chart above clearly shows that whenever BTC/USD rose followed by the Stochastic indicator rising past the 80 level, a reversal followed, resulting in price correcting lower. Similarly, whenever the price fell significantly, followed by the RSI dropping below the 20 level, a bounce-back came into play, signaling the upward momentum.
Bollinger Bands
Bollinger Bands is a technical indicator that measures volatility as well as overbought and oversold conditions. It comes with three line: upper band, lower band, and a Simple Moving Average (middle band).
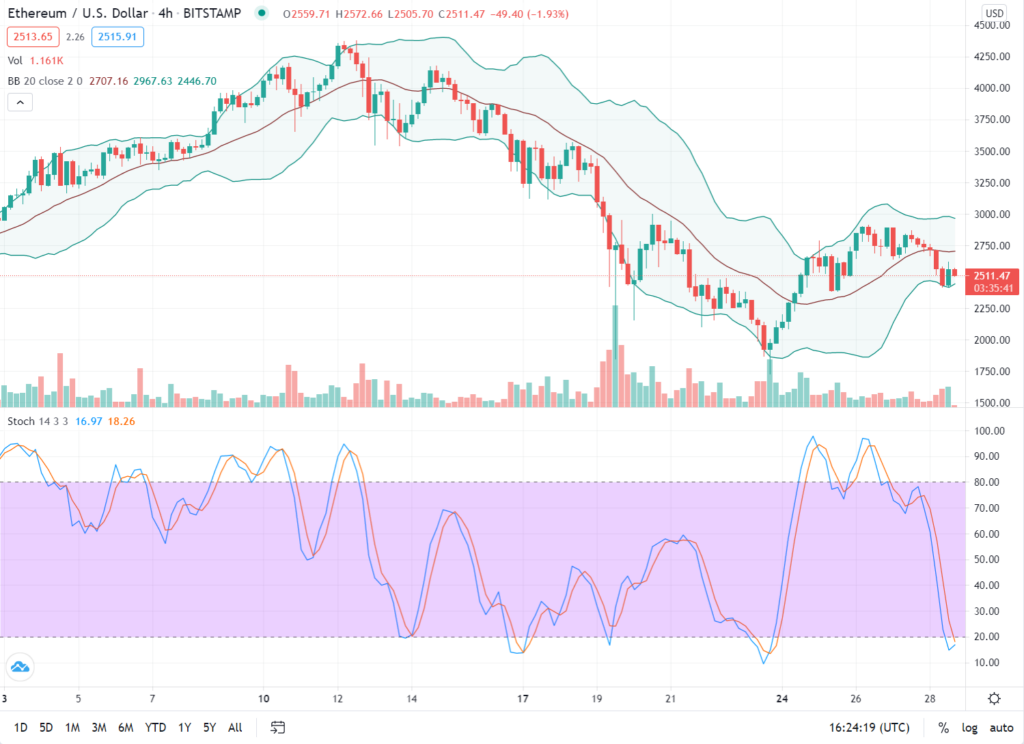
It is based on the assumption that the price should always be in the middle of the band or close to the simple Moving average. Whenever it rises to the upper band or above, it shows overbought conditions, signaling potential correction to the downside. Conversely, the closer it is to the lower band, the more it implies oversold conditions signaling possible correction to the upside.
The chart above shows that as soon as ETH/USD touched the upper band, a reversal came into play, resulting in the price pulling lower to the middle line. Likewise, the pair tanking to the lower band resulted in a correction to the middle line.
Additionally, a squeeze is a phenomenon that occurs during periods of low volatility where all bands are very close to each other. If this were to happen, the same could hint at potential future volatility.
On Balance Volume
When playing in the cryptocurrency scene, it is also important to maintain a close look at the volume flow on various coins. In most cases, volume always precedes price; therefore, it can be used to confirm the next move.
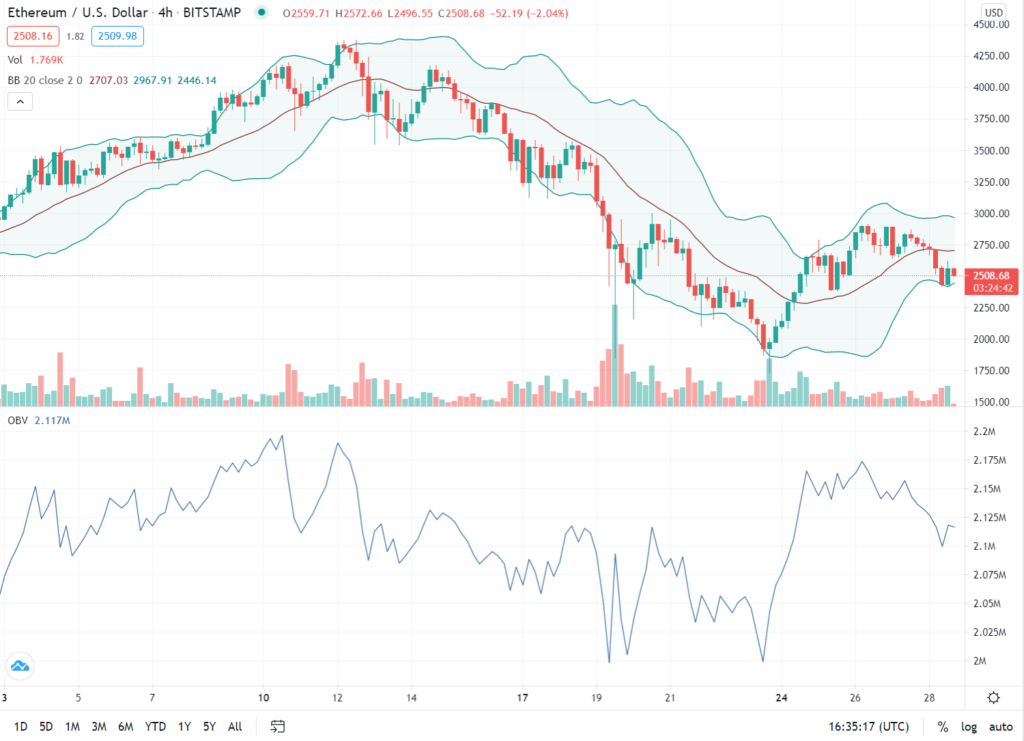
The On Balance Volume tool can be used to learn whether the volume is increasing or decreasing in comparison with the price movement. For instance, in the picture above, when Ethereum is trending up and the OBV trending up, it signals that buyers are increasingly flocking the market and that a digital currency is likely to continue moving up.
Additionally, if the digital currency is climbing higher but the OBV is in a downtrend, the same could be a warning sign. The divergence between price and OBV could reveal weakness, and that the coin is likely to correct lower.
Fibonacci retracement
The Fibonacci retracement tool allows traders to find support and resistance levels while trading digital currencies. As they oscillate, support and resistance levels come into being, providing ideal entry and exit points.
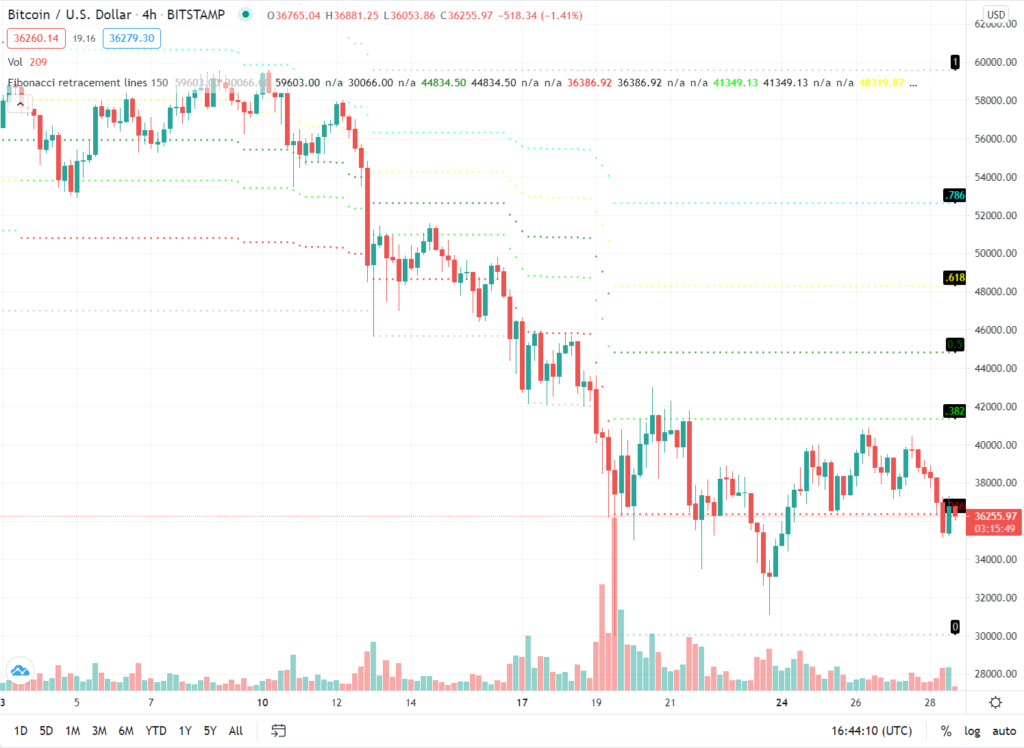
The tool comes with Fibonacci ratios of 23.6%, 38.2%, 50% 61.8% and 100%. Once a digital currency starts edging in a given direction, it often hits a support or resistance and starts correcting in the opposite direction. For example, if in an uptrend, it will start reversing. Drawing the tool from where the trend upwards started to where it has started correcting, it would be possible to determine support levels as they correct lower.
Bottom line
While technical analysis is ideal for studying price action, it is also important to pay close watch to fundamentals. News and developments have a way of influencing investors’ sentiments. For instance, Musk’s sentiments about a cryptocurrency project have triggered wild swings in the market.