Cryptocurrencies are some of the most volatile yet cherished financial instruments in the capital markets. Crypto prices fluctuate widely due to supply and demand changes and changes in investors’ and users’ sentiments. Concerns about government regulations often trigger wild swings, with media hype accelerating the swings.
Amid the wild price swings that come into play daily, successful breakouts, and false breakouts are common. Such price action moves are known to create attractive investment opportunities but, at times, can trigger significant losses.
What is a breakout in crypto trading
A breakout occurs whenever the price of an underlying cryptocurrency moves above a key resistance level, affirming bullish momentum. Likewise, it could entail a move below a crucial support level, signaling the start of a downtrend.
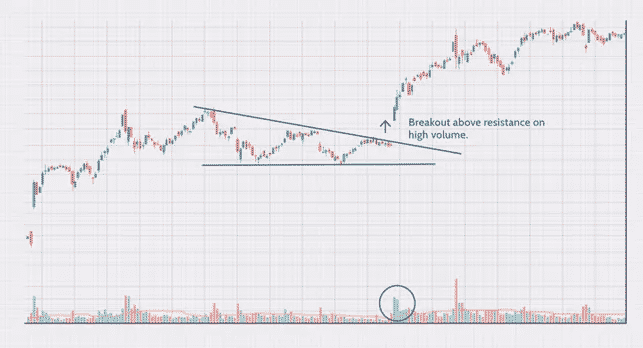
Crypto breakouts that occur in high volume signal strong conviction. Conversely, price is expected to trend in the direction of the breakout with little opposition. Two things are bound to happen whenever the price breaks through support or resistance level.
The chart below clearly shows a crypto breakout above a key resistance level on strong volume.
First, traders on the fence waiting for the breakout would open a position in the direction of the breakout. For instance, whenever a price breaks out and closes above a resistance level, a trader could use the opportunity to enter a long position to try and profit from further upswings.
Similarly, price breaking through support level and closing below would signal a buildup in selling pressure. Traders use this opportunity to open short positions and try to profit from further downside action.
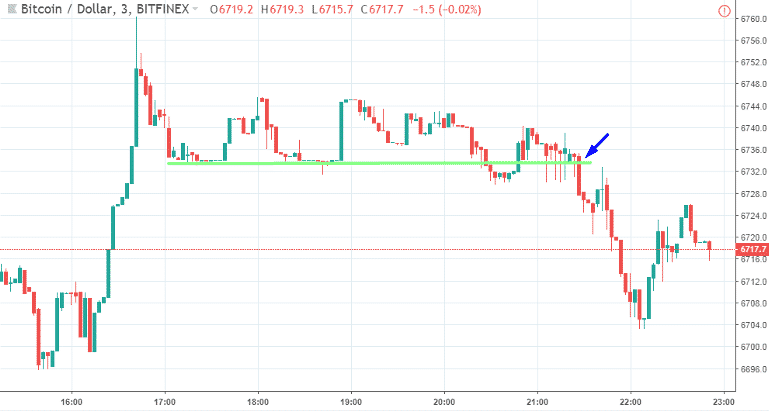
Secondly, some traders with open positions would start exiting their positions whenever a breakout happens to avoid incurring losses. For instance, a trader who was short the market could be forced to close the position as soon as the cryptocurrency price rallies on high volume above a resistance level, signaling the start of an uptrend.
Likewise, a crypto trader who was long an instrument would be forced to close the position soon as prices drop and break through the key support level, signaling the start of a downtrend. By closing the position, the trader would avert the risk of incurring significant losses on price moving lower in continuation of the emerging downtrend.
The flurry of activities that comes into play whenever breakouts occur causes the volume to rise as traders adjust their positions and others enter the market. A higher than usual volume helps affirm a breakout, signaling that the price will likely move in the new direction.
Consequently, whenever a breakout concurs with little volume, the prospect of a reversal occurring is usually high.
Understanding false breakout in crypto
A false breakout occurs whenever the crypto price moves above a resistance level or below a support level but reverses immediately. Such breakouts occur whenever there is no strong volume or momentum to sustain price in the new direction.
For instance, a false breakout can occur on price breaking through resistance level only to reverse direction and start moving lower and closing below the initial resistance level. A failed breakout to the upside implies there was not strong enough buying interest to keep pushing the price above the resistance level.
Once the price starts retracing lower, traders who had triggered long positions start exiting the market. Their action oftentimes fuels a drop as short-sellers also enter the market and start pilling pressure.
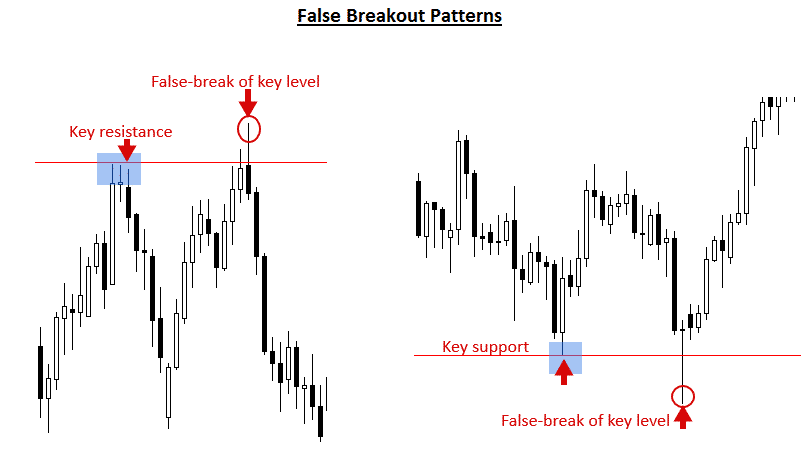
Likewise, it could occur on price moving below a crucial support level as if to signal the start of a downtrend only to reverse course and start moving up. Once the price reverses course and starts moving up, it implies there was not enough selling pressure to sustain the move lower. Consequently, traders who had entered short positions use this opportunity to exit the market.
Breakout patterns in crypto trading
The extreme levels of volatility in the cryptocurrency market give rise to some of the best breakout patterns. Technical traders pay close watch to some common chart patterns to spot potential breakouts through support and resistance.
Triangles
They are chart patterns that occur whenever price moves in a given direction only to pause as exhaustion kicks on traders taking profits. An ascending triangle occurs when the price moves up only to pull back and starts oscillating in a triangle-like pattern.
As long as the price oscillates within the triangles dimension, the market remains bullish, with the upper channels acting as resistance and lower channels as support. In most cases, a breach of the upper trendline forming the triangle pattern would signal a bullish breakout.
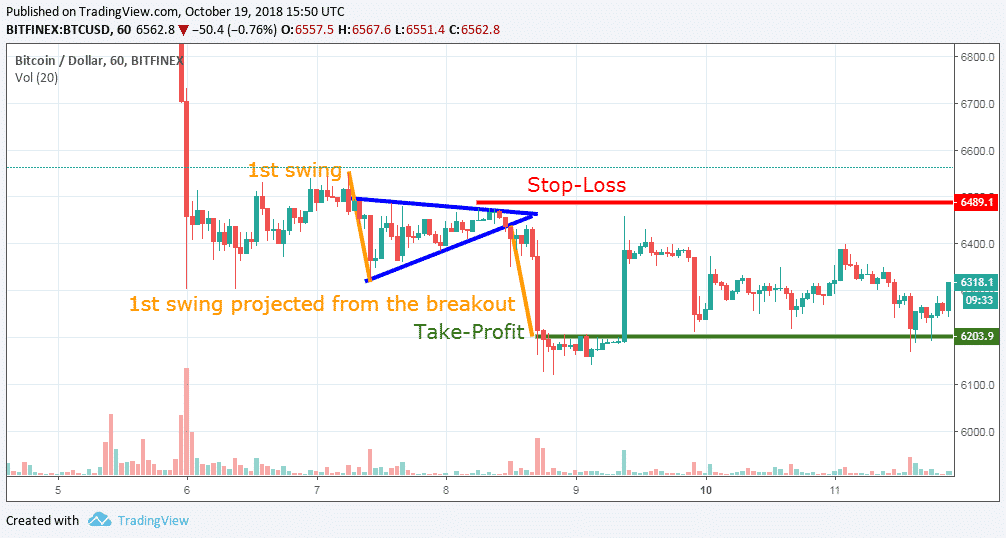
If the triangle pattern occurs in a downtrend, the likelihood of the price continuing to move lower on a breach of the lower trend line of the triangle is usually high. Consequently, technical traders eye short positions whenever a triangle pattern forms when the price moves lower.
Flag patterns
Flags are other patterns that technical traders looking to profit from breakouts pay close watch to. Just like triangle patterns, flags occur whenever a price moves in one direction only to consolidate and start moving up and down in a channel that is flag-like.
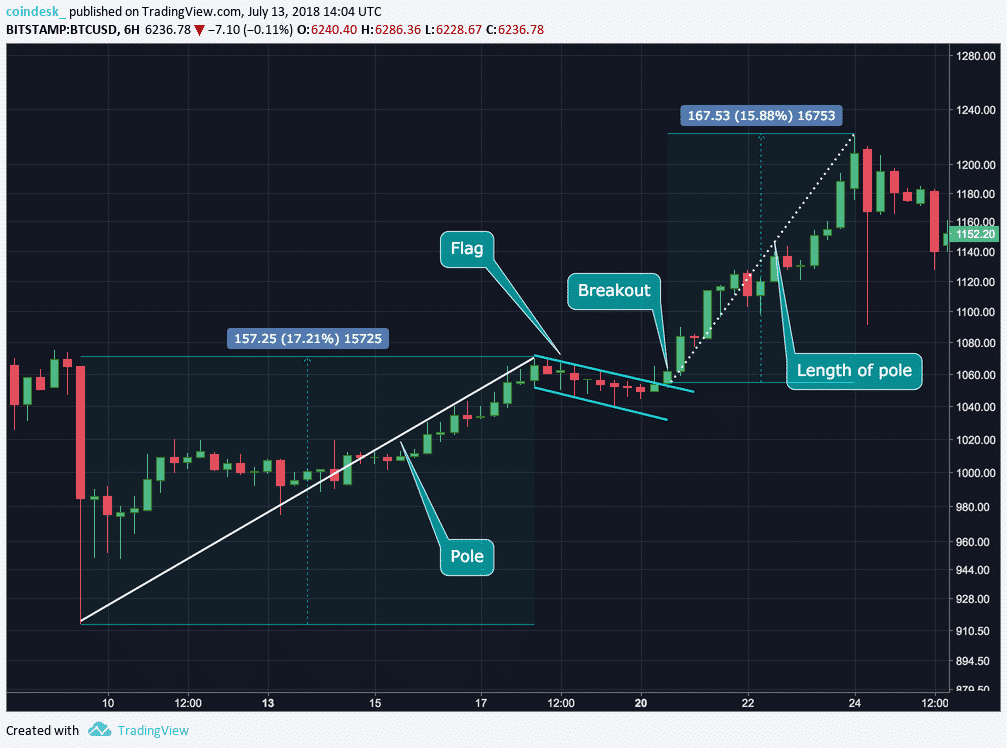
When the flag pattern occurs as the price is trending up, it signals exhaustion, which could result from buyers taking profits after a strong move up. As price oscillates within the channel, a buildup in buying pressure often triggers a breakout above the upper channel of the flag, affirming a bullish breakout. Once the breakout occurs, traders use the opportunity to enter a long position.
Similarly, whenever the flag pattern occurs on price moving lower significantly, it acts as a bearish signal. The prospect of the price moving lower on breaching the support is usually high. Consequently, traders use the opportunity to short the asset.


