

Chart analysis is an important concept in day and swing trading. It refers to the process where a trader looks at charts and determines whether to buy or sell an asset. One can depend fully on these patterns or incorporate fundamental analysis in making decisions. In this article, we will look at some of the most bullish chart patterns in cryptocurrency trading.
Double Bottom
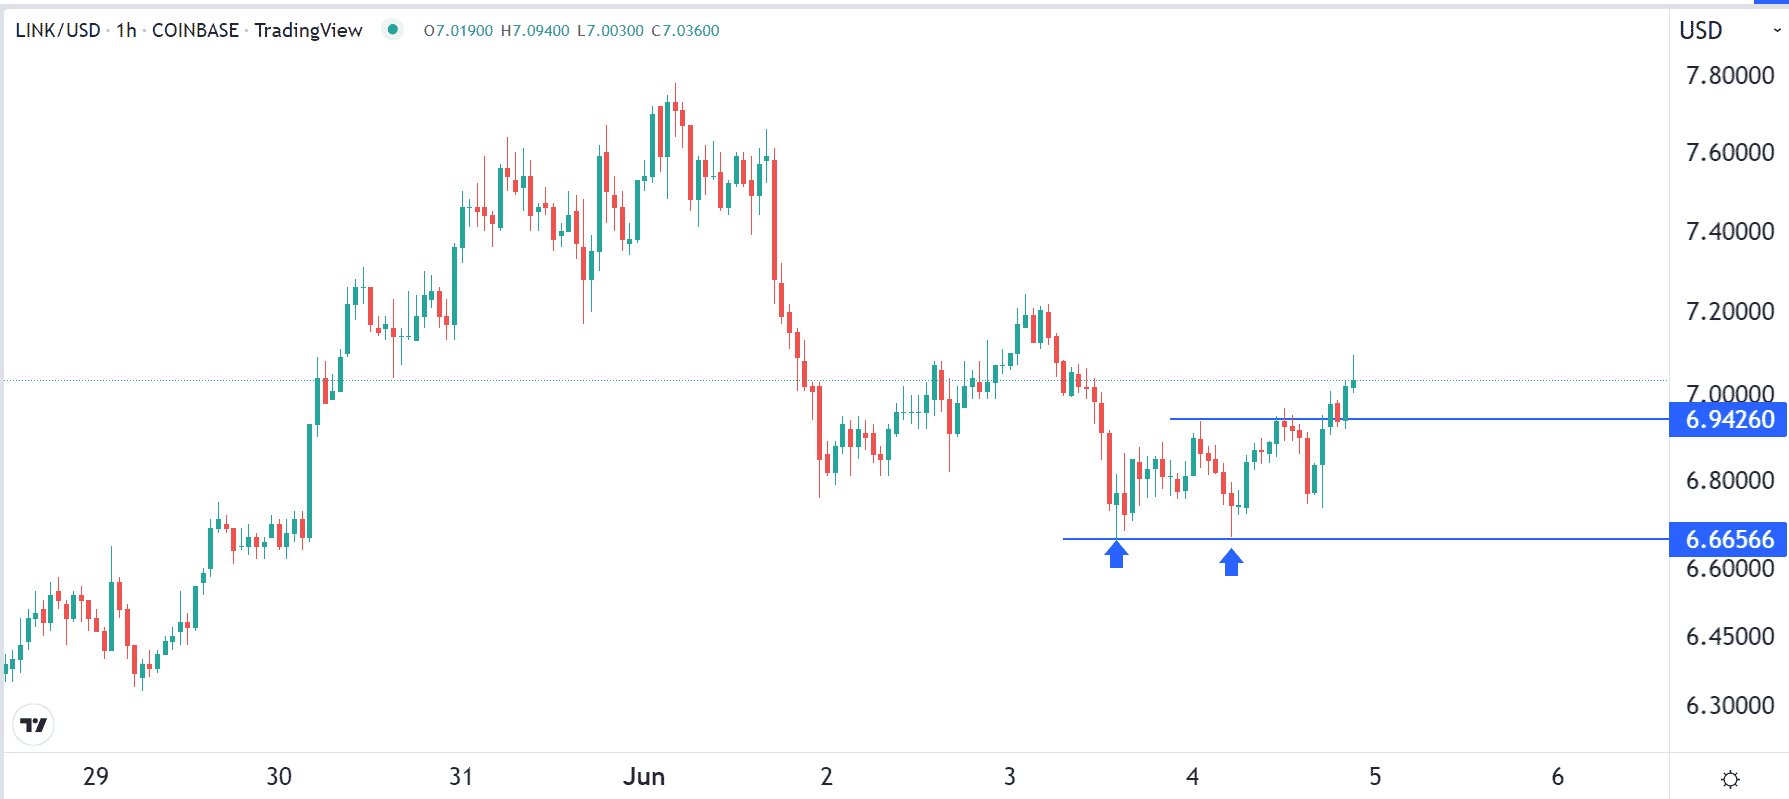
The double bottom is one of the most bullish chart patterns in price action analysis. It refers to a situation where a cryptocurrency struggles to move below a certain level of support.
Its formation is relatively easy to explain. First, a cryptocurrency should be in a bearish trend when it falls to a certain level. Let’s call this $6.65. After falling to this point, the coin will start rising as buyers move to buy the dip. However, this uptrend is usually short-lived and the coin finds a resistance at another level, say, $6.94.
Third, the asset will then start moving downwards and then find no more sellers below the initial support at $6.65. With no more sellers left, the coin will start a new bullish trend. But for this uptrend to be validated, it needs to move above the resistance at $6.94. If this happens, the coin will likely continue with the new bullish trend.
There are several approaches to trade this pattern. First, it is recommended that you set a bracket order that has a buy-stop above the resistance and a sell-stop below the support. In this case, if there is indeed a bullish breakout, the buy stop trade will be initiated.
On the other hand, if the double-bottom pattern is invalidated, the sell-stop coin will be initiated. Second, there is a concept of break and retest, which happens after the initial breakout. When it happens, the coin may retest the chin of the double-bottom. A good example of a double-bottom pattern at work is shown in the chart below.
Bullish flag or pennant pattern
Another extreme bullish pattern is known as a bullish flag. It is a continuation pattern that forms when an asset is in an uptrend or after it goes parabolic.
A bullish flag has a close resemblance to a hoisted flag. In this, the asset moves up parabolically or slowly and then it starts to consolidate. As it consolidates, the coin forms what looks like a rectangle pattern.
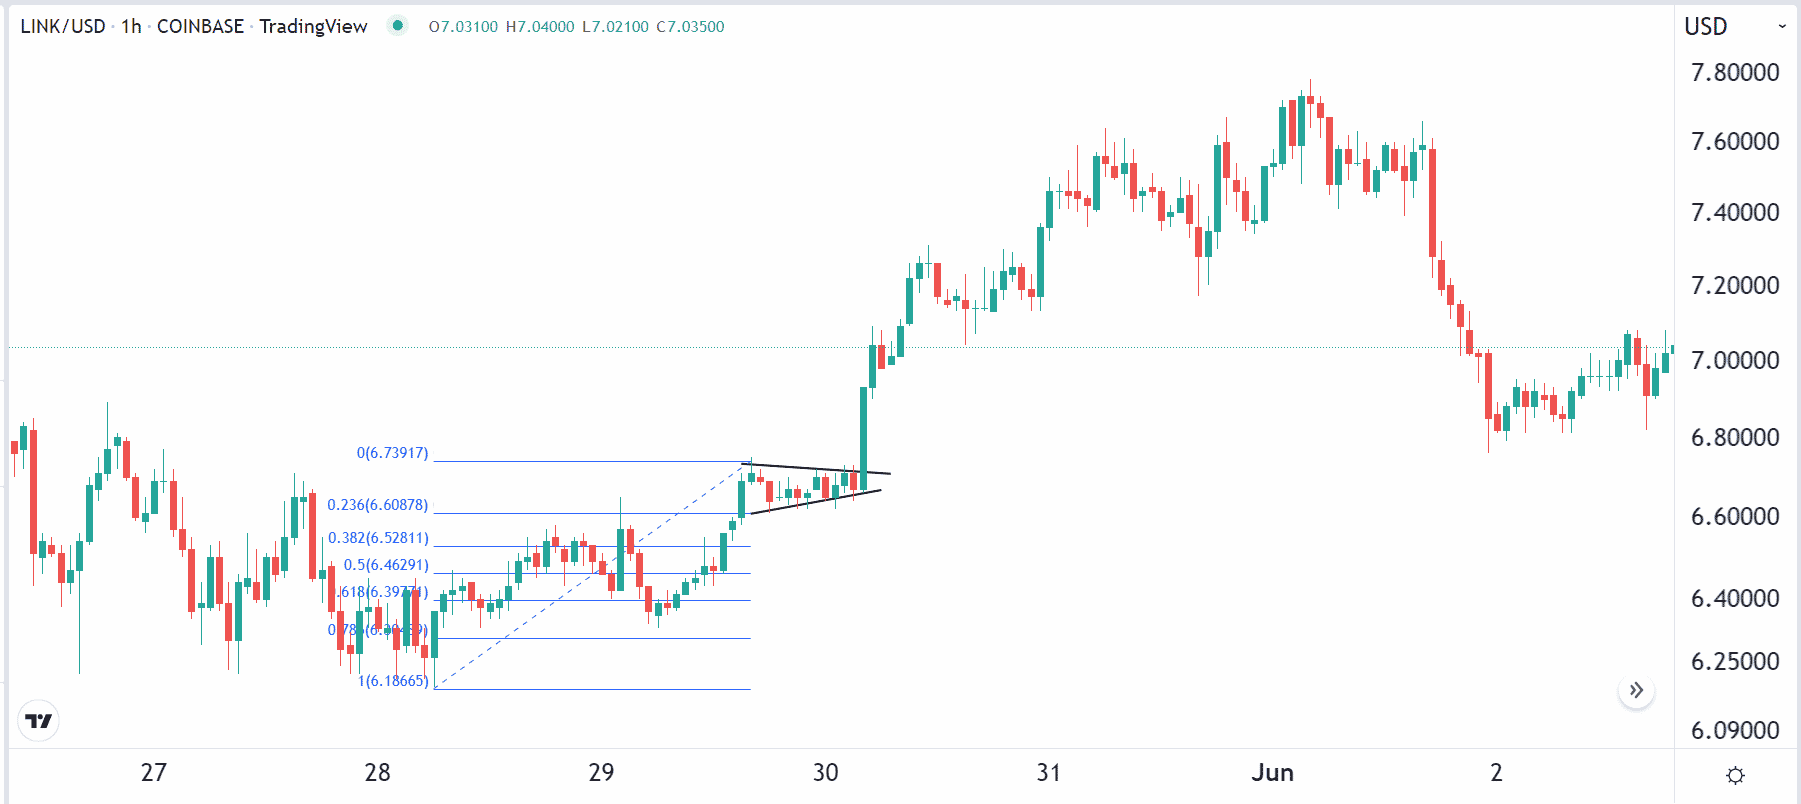
A bullish pennant also has a close resemblance of a flag pattern. The only difference is that instead of a rectangle pattern, it forms a small triangle after going parabolic. In most cases, the bullish flag and pennant usually leads to a bullish breakout.
A good way of trading the flag or pennant pattern is to place a buy-stop above the upper side of the flag. Another good approach is to combine this strategy with Fibonacci Retracement. The flag is usually invalidated if the price moves below the 38.2% retracement point.
A good example of a bullish pennant pattern is shown in the Chainlink chart below. As you can see, a chart tends to form multiple pennants and flags during an uptrend.
Golden cross
Moving averages are the most popular technical indicators in the financial market. They are important because they show the average price of an asset in a certain period. So, if Bitcoin is trading at $30,000 and the 14-day moving average is at $20,000, one can argue that the coin is getting overvalued.
There are several strategies for using moving averages to trade. One of the most popular approaches is to find reversals. To do this, traders usually apply a short (fast), and a long (slow) moving average on a chart and wait for their crossover.
A golden cross forms when the 200-day and 50-day moving make a crossover as the cryptocurrency price rises. A good example of a golden cross pattern is shown in the chart below.
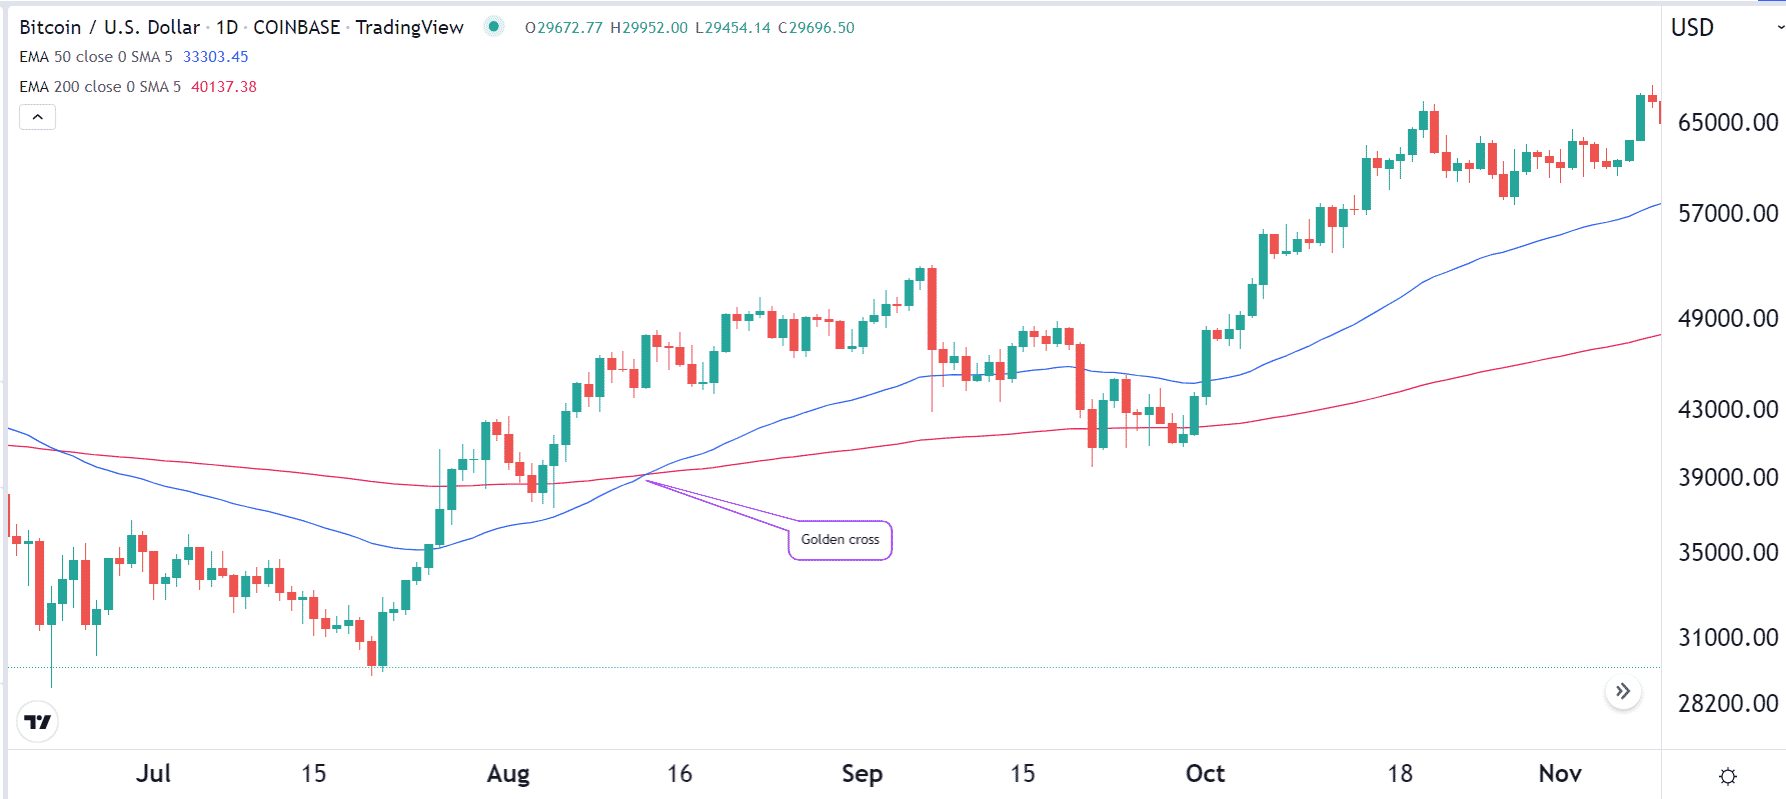
For day traders, however, a golden cross with the 200 and 50 parameters is usually not feasible because of how long these periods are. Therefore, traders usually adjust the periods to smaller timeframes, such as 25 and 50.
Ascending triangle
Triangles are some of the most popular patterns in the market. There are three types of these triangles: ascending, descending, and symmetrical. Of these three, ascending triangle is the most bullish.
The triangle happens when a cryptocurrency finds resistance at a certain level. It then struggles to move above the point multiple times while finding an ascending support point. In due time, the coin tends to have a bullish breakout when the price moves above the resistance point.
A good way to trade an ascending triangle pattern is to set a buy-stop above the upper side of the triangle. In case a bullish breakout happens, the buy-stop will become a market order, and the price will continue rising.
Falling wedge
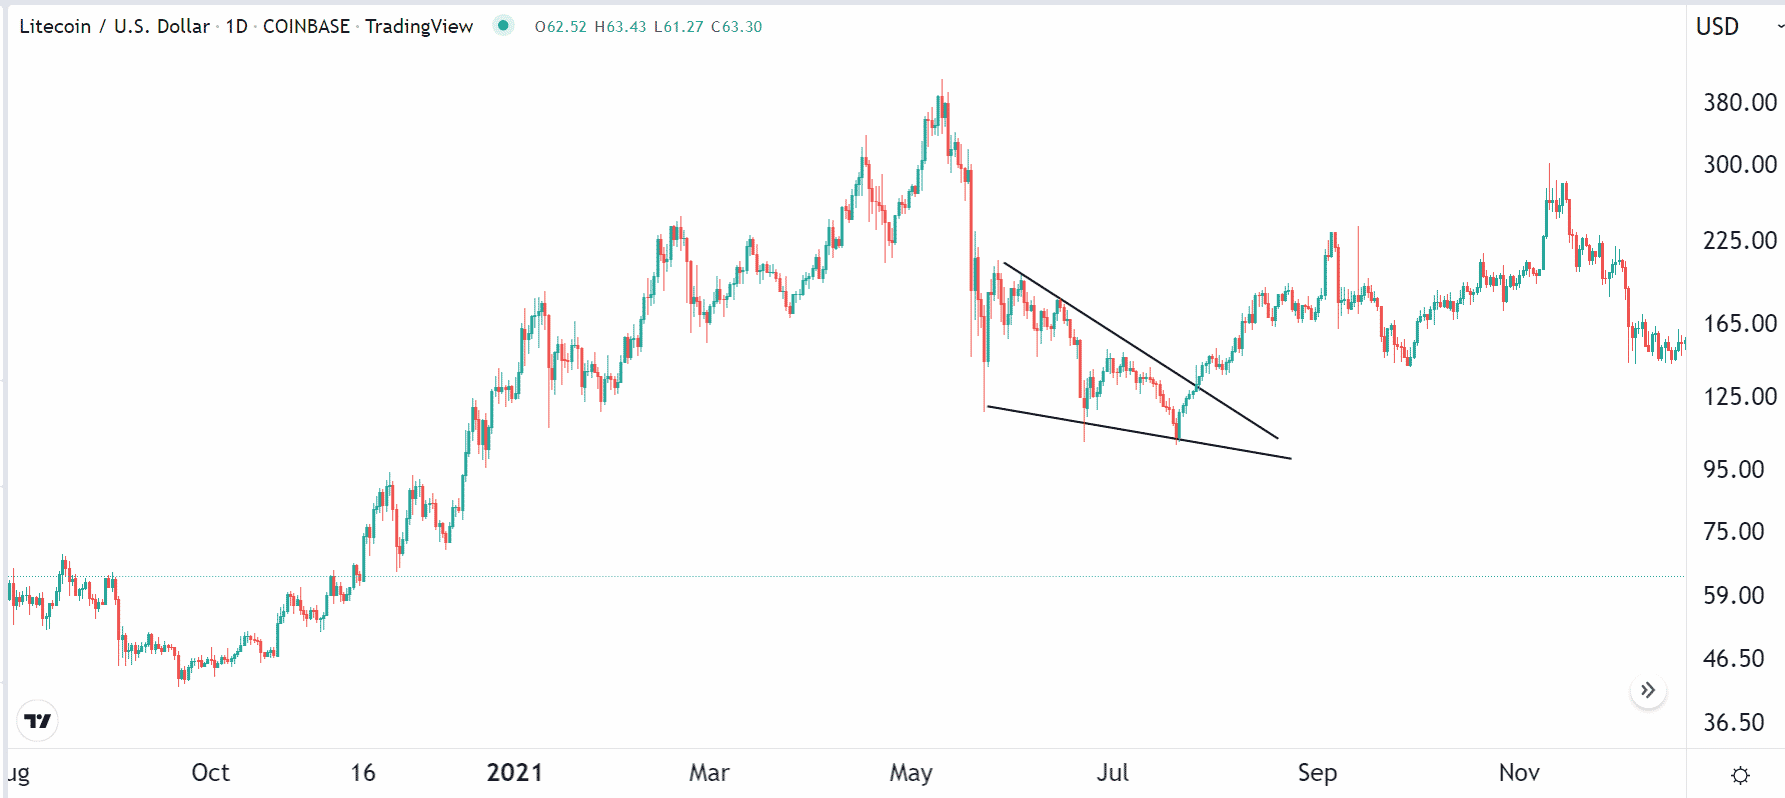
Another popular bullish pattern is known as a falling wedge. It refers to a situation where a cryptocurrency or any other asset moves lower as it loses momentum. In this case, the trading range narrows as the coin keeps falling.
In most cases, the coin will have a bullish breakout when the wedge pattern nears its confluence level. A wedge can be used by both long-term investors and day traders since it can happen in all chart timeframes. A good example of a falling wedge pattern is shown in the chart below.
Summary
There are other examples of patterns that are usually highly bullish in the market. Some of these are candlestick patterns like a hammer, morning star, bullish engulfing, and doji patterns. However, in most cases, these candlesticks tend to be less reliable than the chart patterns mentioned above.