


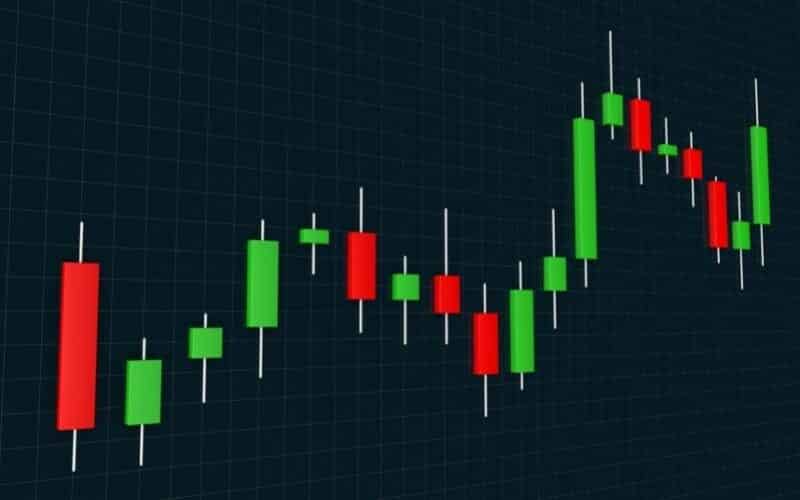
Candlesticks are the most popular chart types in the financial market. Unlike others like renko and line charts, they provide more details known as OHLC that are useful to traders. O is for open, H for high, L for low, and C for close.
In this article, we will explain what a candlestick shadow is and some of the most popular strategies you can use.
Parts of a candlestick
A candlestick is used to represent a certain period. For example, in a daily chart, one candlestick represents a single day. Similarly, in an hourly chart, one candlestick refers to the price action per hour.
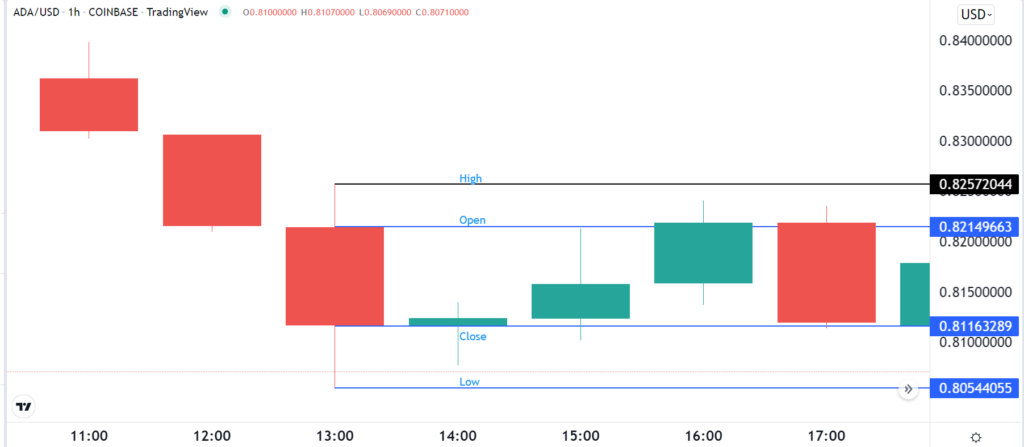
Therefore, since the chart below is hourly, it means that Cardano’s price opened at $0.8215 and ended the hour at $0.8116. In the same period, the coin’s price rose to a high of $0.8257 and reached a low of $0.8054.
The block between the open and closing price is known as the body. It is where the price spends most of its time during the period.
The line above the open and below the close is known as a shadow or a wick. At times, these shadows can be extremely long or short. Further, it is possible for a candlestick to exist without having an upper and lower shadow. This situation happens when the price does not move outside the closing and opening prices. Such a candle, if it is extremely big, is known as Marubozu.
At other times, a candlestick can have an upper shadow and lack a lower one and vice versa. So, let us look at some of the popular candlestick shadow trading strategies in cryptocurrencies.
Standard doji pattern
One of the most popular strategies when using candlestick shadows is where you use it to identify reversals in a chart.
A simple way is to use a standard doji candlestick pattern. A doji happens when an asset opens and closes at the same price. As such, this pattern can have long upper and lower shadows and then an extremely small body.
When that pattern happens during a downward trend, it can send a sign that a reversal is about to happen. Therefore, in this case, a crypto trader can execute a trade on the opposite side. However, since not all doji patterns develop to a reversal, the participant can opt to wait until the new pattern starts.
A good example of this price action at work is in the chart below. As you can see, the coin was in a strong downward trend until the standard doji patterns formed.
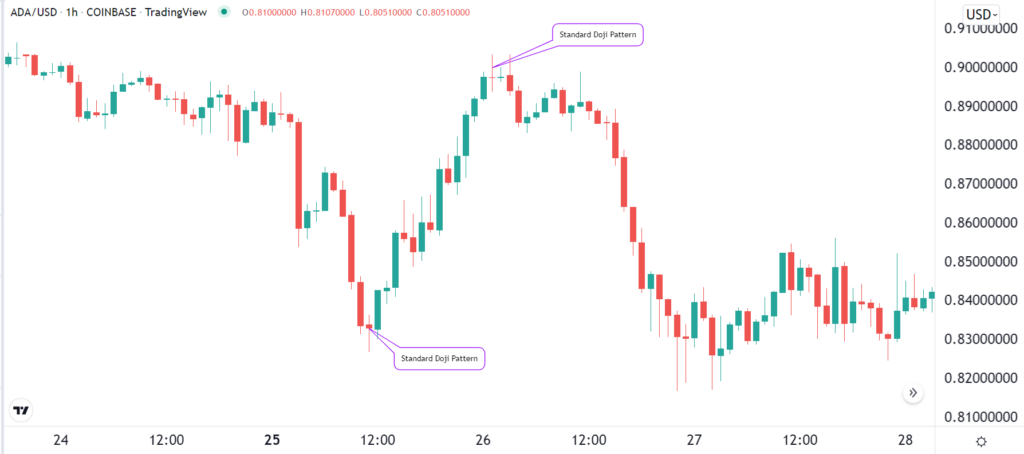
These patterns were followed by bullish and bearish reversals.
Pending orders
Another candlestick trading strategy is to use pending orders, especially when an asset makes long shadows. The idea behind this is simple. After making a long upper or lower shadow, the asset’s price will either continue in that direction or start a new trend.
Therefore, in case of a long upper shadow, a trader can open a buy-stop slightly above the price. In this case, a bullish trade will be initiated if the price continues to rise. It is assumed that this trend will continue. If it fails, the pending order will not be initiated, meaning that you’ll be safely sitting on your hands.
Hammer candlestick pattern
Another way of trading candlestick shadows is known as the hammer pattern. It is one of the most popular reversal patterns in the industry.
As the name suggests, a hammer is made up of an extremely small body and a long lower shadow. In most cases, this pattern does not have an upper shadow. At times, the shadow is usually extremely short.
A hammer pattern is a reliable sign that an asset’s price is turning around. Therefore, one of the best ways to trade it is to open a buy-stop slightly above its upper side. For it to work well, the coin should have been in a bearish trend initially.
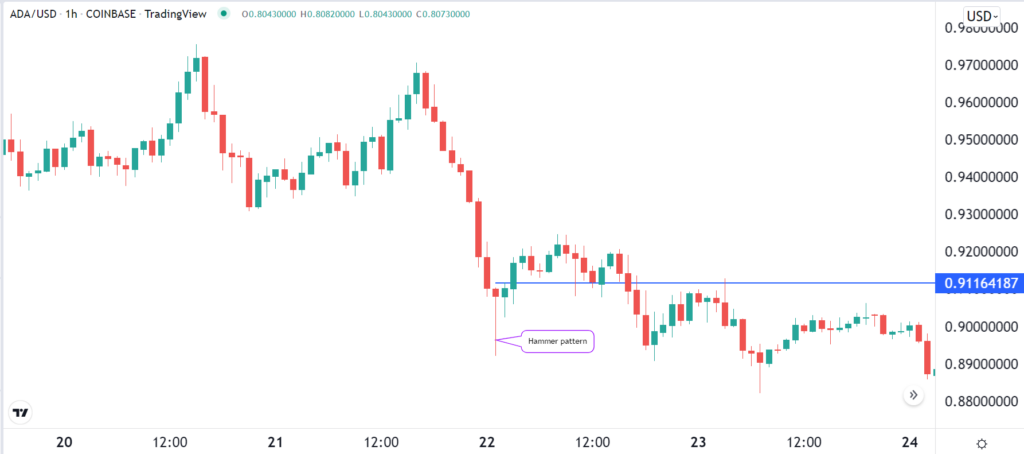
The chart below shows that the hammer pattern formed after the coin declined sharply. It then made a small reversal pattern. Therefore, a trader could have placed a buy-stop trade and then took advantage as the price rose.
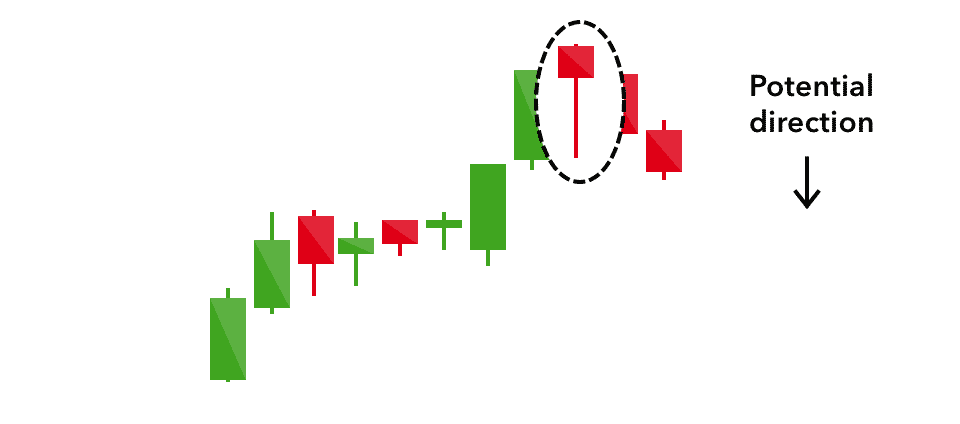
The extreme opposite of a hammer pattern is known as an inverse hammer. It happens when, during a downtrend, an asset’s price forms a small body and a long upper shadow. In most cases, the pattern is usually followed by a bullish reversal as well.
Another form of a hammer pattern is one that happens during a bullish trend. When this happens, a shooting star pattern happens when the price forms a small body and a long upper shadow, while a hanging man happens when it has a small upper body and long lower shadow.
These patterns are usually signs of reversals, as shown above.
Other doji patterns
In the previous section, we noted that a standard doji is one way of using candlestick patterns. Still, there are more ways of using other types of doji patterns. First, there is a gravestone doji pattern, which happens when the price has a tiny body and an extremely long upper shadow. In this case, a trader can open a bullish trade that is above the upper shadow.
The other type is known as a dragonfly doji. It happens when an asset’s price has a tiny body and an extremely long lower body. Similarly, in such a situation, an ideal situation would be to set a sell-stop slightly below the shadow.
Summary
Candlesticks have been used by traders for centuries. They were initially used in Japan by rice traders in the 1600s. Today, they have become pivotal tools in day trading all assets. In this article, we have looked at some of the most popular candlestick shadow strategies to use in trading.