


Penny cryptos, or cryptos with a value of less than $1, make up the majority of cryptocurrencies currently on the market. You should keep an eye on the market and do an extensive study on new, up-and-coming crypto coins if you want to invest in one of these tiny cryptocurrencies early on.
Inexperienced traders frequently ask themselves which time frames to monitor when trading cryptos that are valued at less than one dollar. Professional traders choose a time window of roughly 30 seconds. Regardless of their trading strategy or technique, or the market in which they’re trading, they choose a time period based on their personal preferences. For the most part, it depends on the person’s own trading style.
Analysis of longer time horizons yields more accurate results. When time frames are shorter, the charts get more cluttered with erroneous trades and noise. When determining the primary trend, you should use a larger time frame.
Weekly timeframe
In traditional markets, this time span falls under the heading of position trading. This type of short-term trading is the least risky form of short-term trading, although it is still shorter than a long-term investment strategy.
You can spot a market trend and then ride it up or down until the price reaches a resistance or a support. This form of trade allows you to capitalize on price fluctuations. There is often a psychological barrier in the market that prohibits the price from rising above this level. The opposite of a resistance level is a price that the market has a hard time “breaking below.”
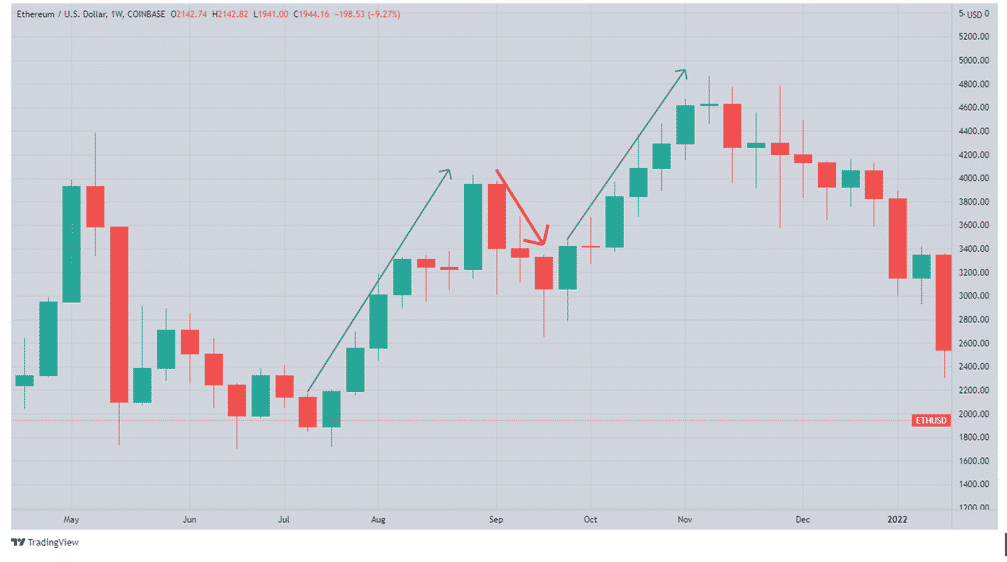
As you can see in the image above, a common position-trading technique incorporates the following steps:
- Spot a pattern (using technical analysis).
- Wait for a pullback to occur before making a decision.
- During a pullback in the upswing, look to buy.
- Sell at resistance for a profit.
Daily timeframe
Using this time frame, you can trade for a shorter period of time without having to sit at a computer all day. Investors who place overnight trades are referred to as swing traders in traditional markets.
Rather than following a long-term trend, most swing traders prefer to hunt for crypto that has been bouncing up and down between two price points. As you can see, the strategy involves purchasing at the low end of the spectrum and selling at the high end. You have the option of going in the opposite direction when you work with a broker who supports short-selling services.
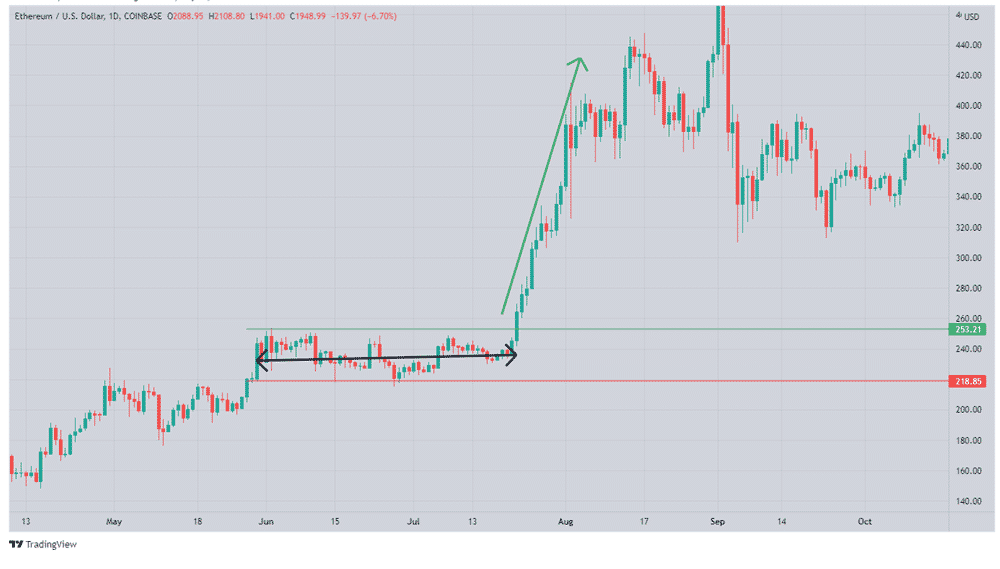
To determine a range, you need to have a strong understanding of technical analysis. You can determine the range of a market using a variety of chart patterns and indicators of technical analysis.
One disadvantage of swing trading over day trading is that in some countries, you may be unable to take advantage of the optimum tax rate designed specifically for day traders.
Multiple timeframes
In order to find trading opportunities, multiple time frame analysis looks at the same market from many chart time frames. You can apply this strategy to a variety of markets, including equities, commodities, and foreign exchange, but it is particularly effective when trading cryptocurrency.
A multi-timeframe analysis trader employs a longer time frame chart to examine for larger trends. Next, a smaller time frame chart is used for more precise entry and exit points.
In order to keep an eye on two charts at the same time, many traders use multiple monitors or windows. Before making any short-term trades, they might look back to the long-term trend. Many expert traders use multiple monitors because they allow them to view multiple time frames at the same time.
With several monitors, you can also examine the values of technical indicators over a wide range of time frames. For instance, even though the 1-day Relative Strength Index (RSI) may be bearish, a 1-minute chart may be bullish at the same time. Instead of looking at the complete chart, you may use the 1-day RSI value to help you decide which way to trade on the 1-minute chart.
The erratic nature of cryptocurrency prices makes day trading a popular strategy. With this strategy, the trader is able to enter the trade and exit it inside the same trading day. Day traders are more inclined to pay attention to 30-minute trends and look for hints on the 5-minute chart.
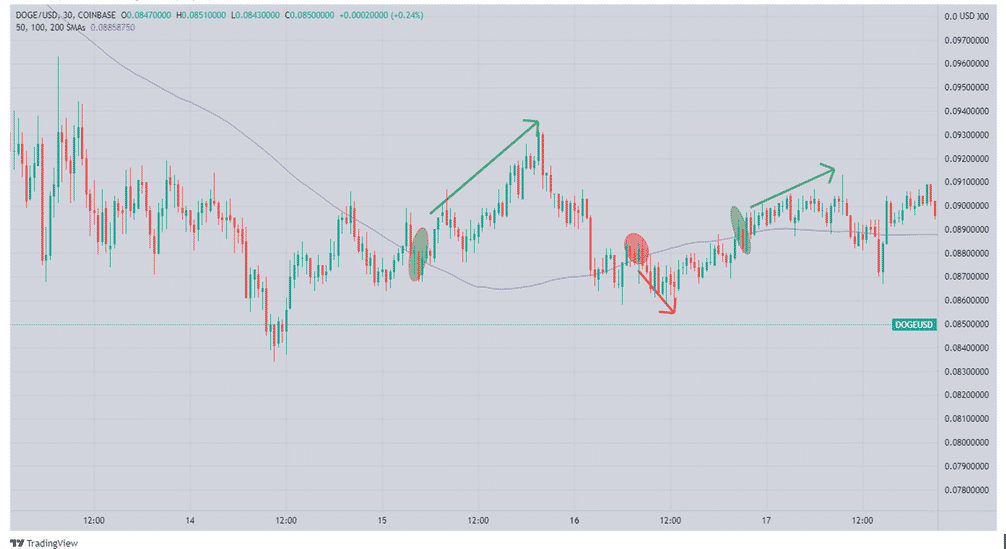
In the chart above, the trader looks at the 30-minute chart of Dogecoin and adds the 200-period Simple Moving Average to it. This helps the trader evaluate the longer-term trend for day trades. This is akin to discovering a four-day trend in the data. Thereafter, the trader notices a strong trend in Dogecoin, which holds above the Moving Average.
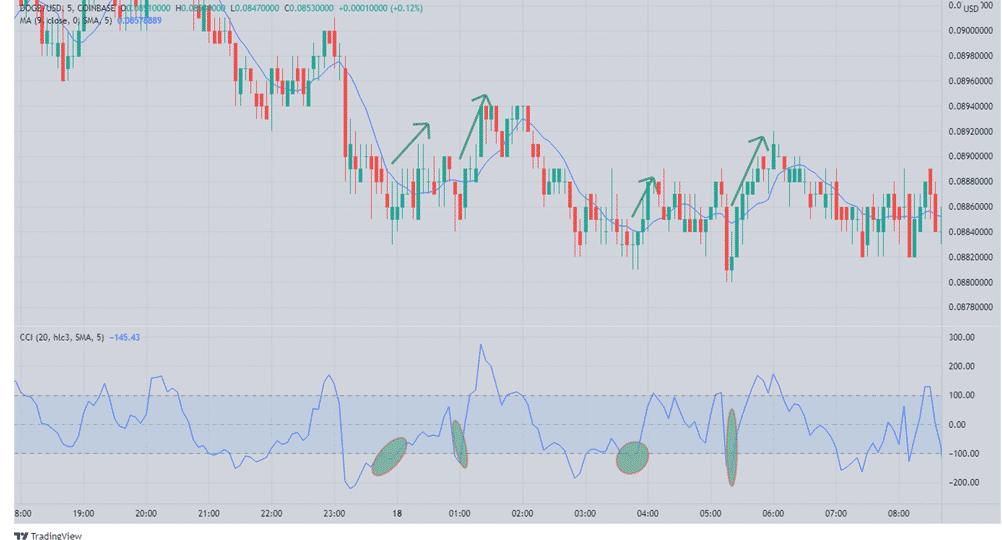
On a 5-minute DOGEUSD time frame above, the trader shifts down and applies an indicator like the Commodity Channel Index (CCI). A signal to purchase is given when the CCI crosses above 100. However, because the 30-minute chart shows that the trend is up, the trader will only look at purchase signals and disregard sell alerts.
In summary
In order to discover trends and entry points, the best periods are dependent on the type of trade and duration of the holding period.
It’s important to note that your trading strategy should specify the optimal time frames for monitoring and trading. The information you see is not affected by time frames, just as volatility is not affected by time frames. Also, there is more detail in short-term charts than there is in longer-term charts. The long-term chart retains all of the detail but zooms out to show long-term patterns rather than short-term fluctuations.