


Trading assets as volatile as cryptocurrencies necessitates a certain level of expertise. The approach you apply, as with other speculative financial markets, can make or ruin your trading career. Choosing a trading strategy, comprehending the huge world of digital assets, and mastering technical and fundamental analysis are all skills that require practice. While there are a variety of methods for determining a crypto’s value and development potential, fundamental analysis remains one of the most effective methods. As a result, you can make more informed investment decisions.
Fear and greed Index
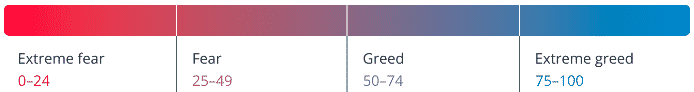
Trends, polls, market dynamics, market domination, social media, and Google’s market volatility are some of the Crypto Fear and Greed Index signals that impact trader and investor behavior. The index assigns a single number between one and one hundred to each cryptocurrency. If the value=1, the cryptocurrency market is likely to decline as people become increasingly concerned and sell their holdings. A range above 100, on the other hand, indicates that the market is due for a correction and that people are overly greedy (i.e., they’re buying more tokens).
When the index value is between 0 and 24, extreme fear occurs. Fear is represented by anything above 24 and below 50, whereas a value of fifty implies market neutrality. Alternatively, greed occurs when the index price is between 51 and 74; however, if the value rises above 74, such as to 75 or more, it indicates excessive greed.
You can avoid being influenced by severe fear or greed by reducing your trading size, establishing a trading plan, keeping a trading journal, and learning from others. Also, limiting the number of your trades is critical for balancing your emotions and trading judgments.
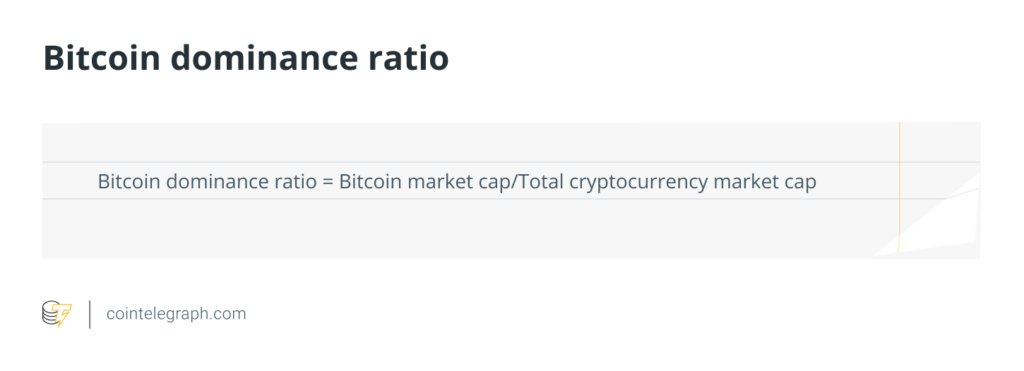
Bitcoin dominance (BTC.D)
BTC.D is defined as the ratio of the market capitalization of Bitcoin to the overall market capitalization of Bitcoin. Because smaller-cap coins follow Bitcoin price swings, its dominance has an impact on the entire market. It calculates the market capitalization of Bitcoin with respect to the rest of the market.
When the index rises, many traders will reevaluate their investments in other cryptocurrencies, and when the BTC.D index falls owing to money leaving the bitcoin market, they become more optimistic about the altcoin market.
When the BTC.D index falls, it indicates a decrease in the capital in the cryptocurrency market, which usually lowers the price of this cryptocurrency; however, when a large amount of capital enters the cryptocurrency market and is divided among other cryptocurrencies, the bitcoin dominance index rises.
Correlation to Bitcoin
Bitcoin correlation refers to the relationship between the price movements of Bitcoin and the price fluctuations of a certain altcoin in the crypto world. It is graded on a scale of -1 to 1.
A score of -1 or close to it indicates a negative correlation between the altcoin in question and BTC. This indicates that the prices of these two coins tend to move in different ways. A score of 0 or close to zero indicates that the two prices are unrelated. A score of 1 or close to 1 indicates a significant positive relationship. This indicates that the two coins’ prices are moving in lockstep.
Generally, you should invest in assets that have little to no correlation with one another. This reduces your risk exposure because a single coin’s bad performance will not have a significant impact on your entire portfolio.
Stock-to-flow indicator
This is a widely used price indicator for cryptocurrencies with a restricted supply. Each cryptocurrency is viewed as a fixed, rare resource, similar to precious metals or stones, in the paradigm. Investors use these assets as a store of value because there is a known restricted supply.
The indicator is calculated by dividing the total circulating global supply by the quantity produced every year. You may achieve this with Bitcoin by using easily accessible circulation stats and data on newly produced coins. As mining returns decline, the asset’s scarcity is reflected in a larger ratio, making it more valuable. This is also seen in the flow of new coins into the market as Bitcoin goes through periodic reward halving events.
Network Value to Transactions Ratio (NVT)
It is calculated by dividing the market capitalization of a coin by the daily transaction volume.
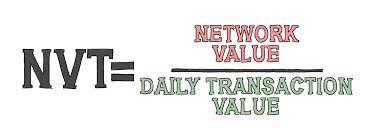
The daily transaction volume is considered as a proxy for a coin’s underlying, inherent value. This concept is based on the idea that the more volume is moving through the system, the higher the project’s value. The market could enter bubble territory if a coin’s market cap rises while daily transaction volume falls. Prices are increasing without a corresponding growth in the underlying value.
On the contrary scenario, a coin or token’s price may remain unchanged even while daily transaction volume rises. This scenario may indicate a potential buying opportunity. The greater the ratio’s value, the more likely a bubble will form.
Amount held by whales
Whales in the crypto world are individuals or institutions who hold enormous amounts of a particular cryptocurrency’s coins. They grow powerful enough to control the value of a specific cryptocurrency when they accumulate enormous numbers of coins.
Cryptocurrency investors must be aware of whale movements, signals, and behaviors. Most cryptocurrency blockchains are open to the public, and most transactions may be viewed using blockchain explorers.
If a coin’s supply is concentrated in a few wallets, the coin’s price may crash if those wallets sell. Blockchain explorers also show you what others are doing with their coins, such as holding, trading on an exchange, and trading off an exchange, among other things.
Summary
Crypto fundamental analysis involves doing in-depth research on available information about a financial asset. The objective is to determine if the asset is overvalued or undervalued. It can also assist investors in identifying false market prices and determining the true value of a currency. Users can gain confidence in an otherwise uncertain market by taking the time to learn and analyze the indicators and indices discussed in this article.