


- Bitcoin bounce back has stalled near the $36,000 level, with BTCUSD looking vulnerable to losses.
- GBPUSD is under immense pressure amid a resurgent US dollar ahead of the Non-Farm payroll report on Friday.
- Gold is looking increasingly susceptible after safe-havens fail to hold on to gains above the $1800 level.
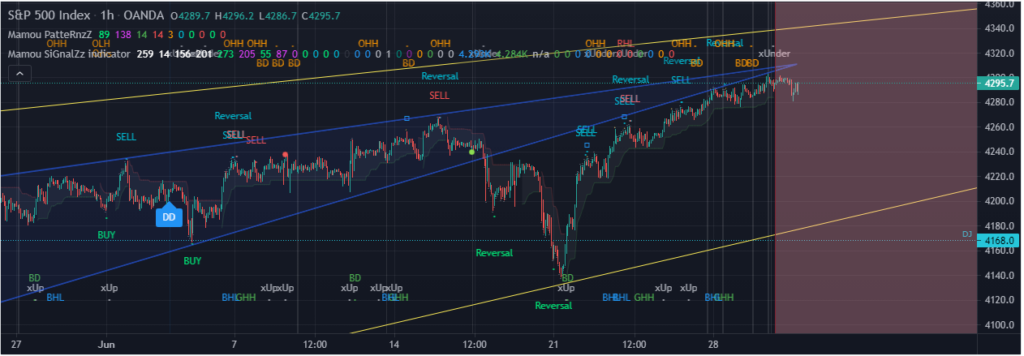
- US indices bull run is under immense pressure after powering to all-time highs at the start of the week.
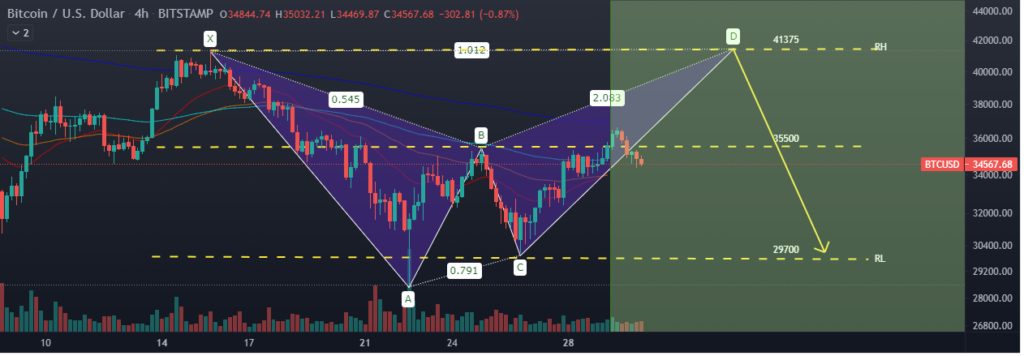
Bitcoin is trying to consolidate above the $34,000 level after a recent sell-off to five months lows. BTCUSD has found support above the $33,800 level as part of the recent bounce back from lows of $28,778 registered in recent days.
Bitcoin consolidation
After the recent bounce back, strong resistance is seen near the $38,000 level near the top of the month-long range.
However, the price needs to rise and find support above the 100-period Moving Average on the four-hour chart to reverse any downtrend. As it stands, the flagship cryptocurrency remains subdued in a tight trading range of between $33,800 and $36,000 level.
Bitcoin sentiments have been rattled in recent days amid a ferocious crackdown in China over trading and mining. Regulatory crackdowns in China and the UK have all but fuelled a sell-off to five months lows from which BTCUSD is trying to bounce back.
Mining and trading activities have declined significantly in China, all but raising serious concerns about the nascent field’s prospects. Additionally, several companies abandoning efforts to register with the UK’s Financial Conduct Authority amid heightened regulatory pressure continue sending jitters about BTCUSD bets.
GBPUSD sell-off
In the Forex market, GBPUSD fell to one-week lows of 1.3824 after the UK’s first-quarter GDP outlook was revised down to -1.6%. The revision downwards affirms slow economic recovery in the aftermath of the pandemic.
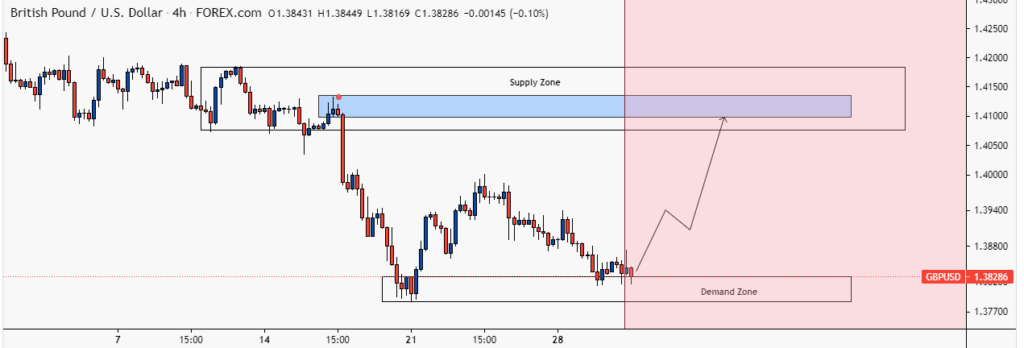
Below the 1.4018 level, GBPUSD looks increasingly bearish and could tank to the 1.3786 level amid a strengthened US dollar across the board. Below the 1.3786 level, the pair could slide to near the 200 days Moving Average of 1.3636.
The slide in the GBPUSD pair has mostly been linked to growing dollar demand. Additionally, Brexit-related news continues to take a toll on the GBPUSD pair, consequently fuelling the push lower.
Gold under pressure
In the commodities market, losses are in the offing on gold, with XAUUSD under immense pressure as the dollar continues to strengthen across the board. Gold continues to trade with a negative bias in the market as the US dollar continues to consolidate near two-month highs.
A plunge to the $1756 level after rejection above the $1790 level has left the precious metal susceptible to further losses. A slide to the $1720 level could be on the offing on the dollar, continuing to strengthen across the board.
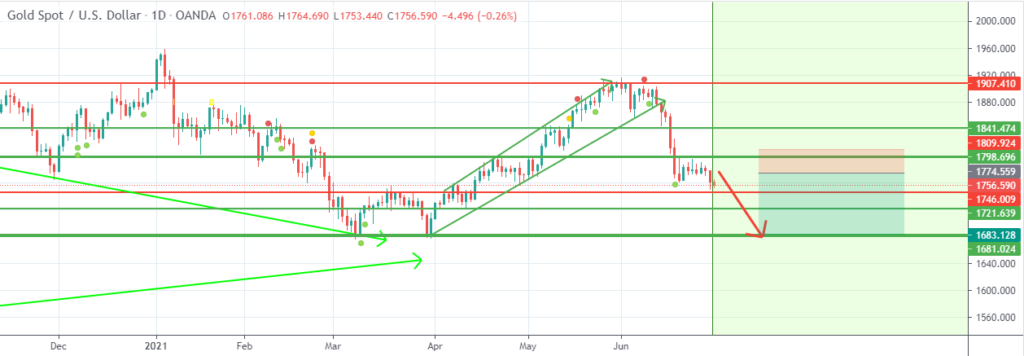
The dollar remains well supported in the aftermath of Federal Reserve President Thomas Barkin reiterating that the central bank has made substantial progress towards the inflation target. Talk of the bank inching closer to tapering asset purchases also continues to offer support to the dollar against the bullion.
However, the escalation of COVID-19 cases in Asia is once again fuelling demand for safe havens. Gold is one of the biggest beneficiaries of risk aversion taking center stage. Further escalation of COVID-19 could help avert further slide on XAUUSD given its safe-haven credentials.
The focus is on the release of private-sector employment data, Chicago PMI, and pending home sales which could sway trader’s sentiments on the greenback consequently affect XAUUSD price action.
Indices bull run fades
Major indices were little changed in the equity markets on Tuesday after starting the week on a roll and powering to all-time highs. The S&P 500 was up 0.1% to 4,291.80, recording its fourth consecutive day of gains. The Dow Jones Industrial Average was up by 9 points to close at 34,292.29 as the NASDAQ Composite index added 0.2% to close at 14,528.33.
The modest gains could be attributed to investors taking a break ahead of a busy earnings season in July. Amid the reduced volatility, the S&P 500 is on course to register its fifth straight month of gains. The NASDAQ, on the other hand, is on course for seven months of gains out of eight.