


- Bitcoin went below $50k on 23 April, a week seeing many other cryptos briefly in the red. This tumble was around 27%, and most reports indicated it was a panic move caused by rumors President Biden might raise capital gains taxes.
- BTC now hovers around the $55k mark, and most of the large and mid-cap coins have also made recoveries.
- How the crypto market will look at the end of April may explain where it could go next. There is mixed analysis over whether we are seeing natural corrections or a looming reversal.
It seems that every time Bitcoin drops to a large round number, media coverage becomes more substantial. The coin dropped just below $50k on Friday for the first time in over a month. However, at the time of writing, it has quickly recovered to around $55k.
So, are there any potential fundamental and technical drivers behind this recent event?
BTC fundamental outlook
There isn’t anything of particular significance at the moment. There will always be articles of notable figures strongly disapproving the project and proclaiming BTC as a ‘bubble that will soon pop,’ but this isn’t anything new.
China’s Xinjiang, one of the primary creation sources for BTC, suffered flooding in its coal mine, which has interrupted the coin’s mining. Theoretically, this means slightly less BTC will be churned out than usual. This could mean a classic case of low supply and high demand, equalling higher prices.
A more interesting piece of fundamental data for the coin is the Crypto Fear and Greed index, one of the popular sentiment indicators for particular cryptocurrencies.
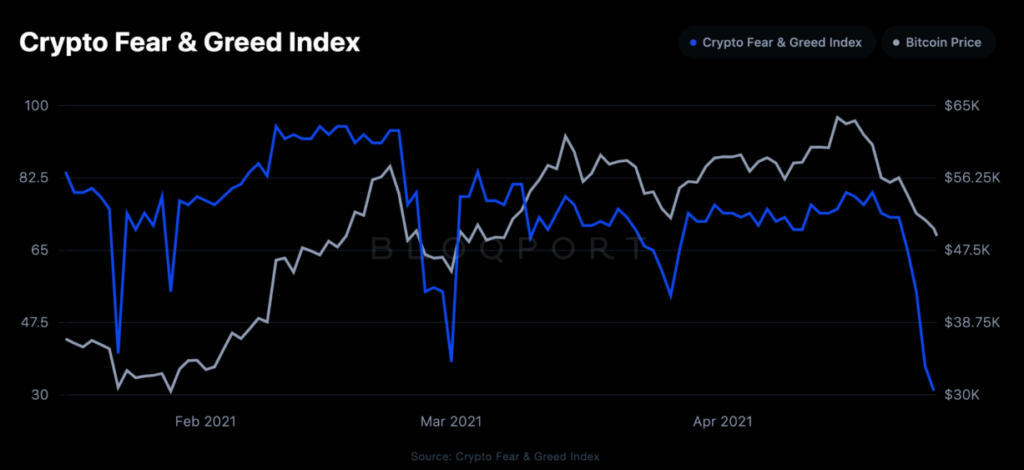
The data used to compile the index considers momentum, volatility, dominance, trends, and social media. It has readings ranging from 0 to 100, where the former points to extreme fear while the latter suggests extreme greed.
At present, the index has dropped to 27, suggesting fear. Fear implies investors are worried — the sign analysts consider a buying opportunity.
BTC technical outlook
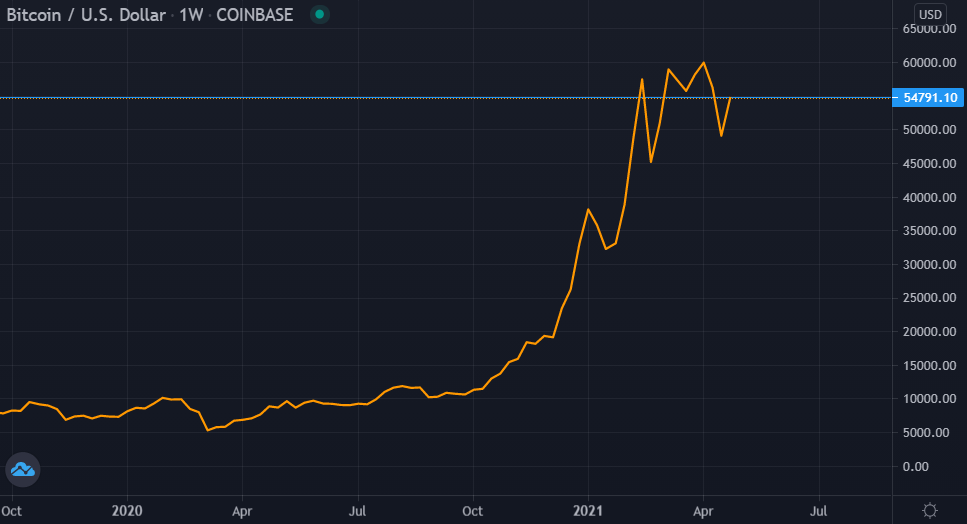
Ever since BTC broke the long-awaited 2017 $20k all-time high in mid-December 2020, the market has only really retraced considerably four times. Each of these drops was around 30%.
Though this decline may surprise many, it shouldn’t be a surprise considering the coin has been in a strong uptrend ever since. Without any technical indicators, it’s clear to witness the consecutive bullish candles.
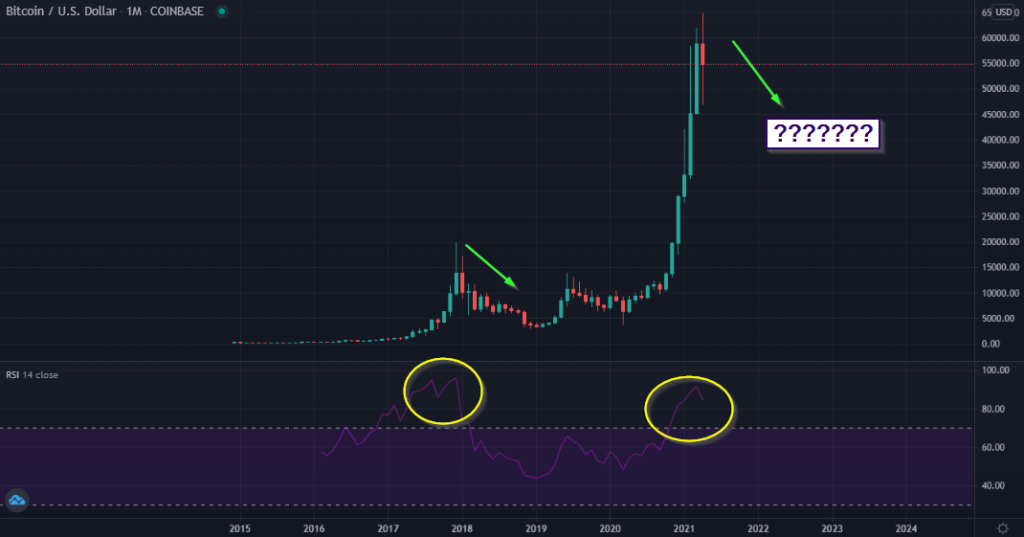
The recent Relative Strength Index (RSI) dynamic indicates very strong momentum on the monthly time frame, which is quite significant in a long-term period of this magnitude. The price action currently suggests the market might close with a bearish candle, despite making highs on each pullback.
If it were to do so by the end of April, this could imply bears may bring the market down considerably. Despite the impressive gains most coins have made in 2021, we should never rule out the possibility of a substantial retracement like what happened at the start of 2018.
Needless to say, no one can predict a market top, though buying BTC at this high price for the long term is probably not the wisest given the history of such bullish markets. On smaller time-frames, there are, of course, plenty of patterns indicating buying the dip, but this would be for a ‘quick buck.’
Where to from here?
The technicals and fundamentals are painting different pictures. Most investors are eager for the coin to breach another all-time high. If we close with a well-defined bearish candle by the end of the month, a bigger correction could be on the cards.
Such an event would likely drive the rest of the cryptocurrency market. Only time will tell.