


Indicators are the ultimate tools for price prediction in the cryptocurrency markets. Technical analysts leverage an arsenal of indicators to try and gain insight into the direction price is moving and the prevailing momentum.
While one is always sure to be spoilt for choice on the indicators to use, Relative Strength Index (RSI) and Exponential Moving Average (EMA) often stand out as some of the best in the business. One can never go wrong with the two, as they provide valuable insight into the prevailing momentum and prevailing market trend.
When combined, the two can be relied upon to shed light on ideal entry and exit points while trading cryptos.
Exponential Moving Average
The Exponential Moving Average gives insight into the overall trend. It shows the direction price is moving and likely to move in the long term. The EMA stands out as it focuses on the most recent price data, which is important when trading volatile assets such as cryptocurrencies.
How to use the EMA
Identifying trends
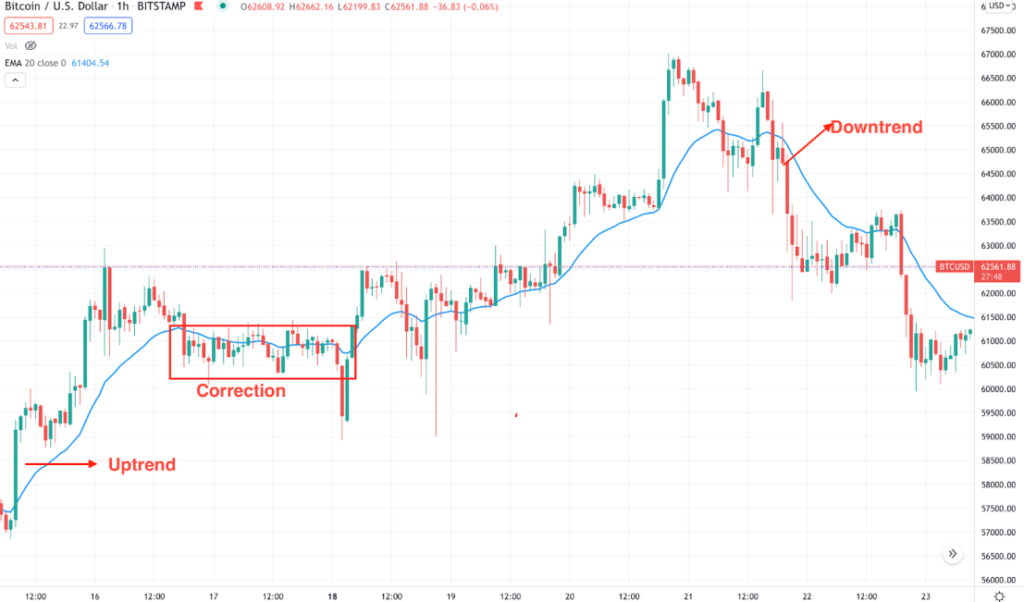
The primary aim of any EMA indicator is to identify the prevailing market trend. Consequently, a cryptocurrency would be considered to be in an uptrend if the price is above the EMA. A trader would look for a buying opportunity in this case.
Similarly, a crypto asset would be considered to be in a downtrend if the price is below the EMA. A trader would look for short or sell positions as long as the price continues to trade below the EMA.
Short-term EMA (12 to 26) are commonly used to determine short-term trends as they respond much faster to price changes, therefore ideal for scalping and swing trading. Long-term EMA (50 to 200), on the other hand, is used to determine medium-term to long-term trends mostly used in positional trading.
Trend following is a common approach that relies on long-term 200EMA. Positional traders and long-term investors open long positions as soon as a crypto price crosses above the 200EMA. On the other hand, a short position would be triggered as soon as the price closes below the 200EMA as it signals a buildup in selling pressure.
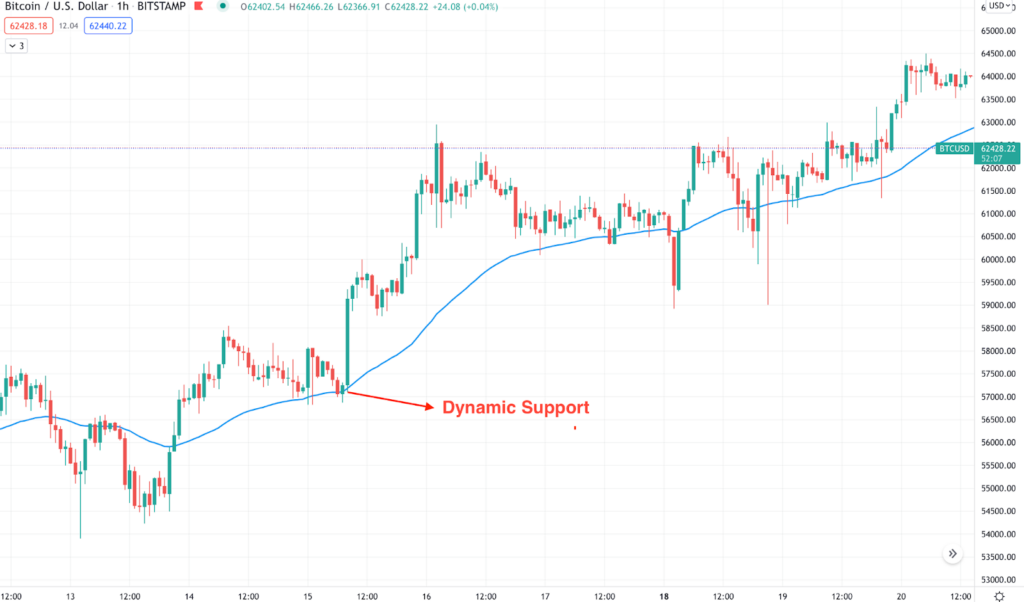
Identifying support and resistance levels
EMA also finds great use in identifying strong support or resistance areas as price trends up or downwards. In case of an uptrend, the price would often pull back to the EMA and bounce back on struggling to close below the EMA, affirming strong upward momentum.
In case of a downtrend, a cryptocurrency price will often pull back to the EMA only to get rejected on strong selling pressure, thus continue edging lower. The EMA acts as resistance whereby short sellers enter the market and push the price lower.
EMA crossover strategy
The use of two EMAs can make it easy to identify ideal entry and exit levels while trading cryptocurrencies. The EMA crossover strategy entails using faster and slow-moving Exponential Moving Averages. A trader could use a 50 EMA as the fast-moving EMA and 200EMA as the slow-moving one.
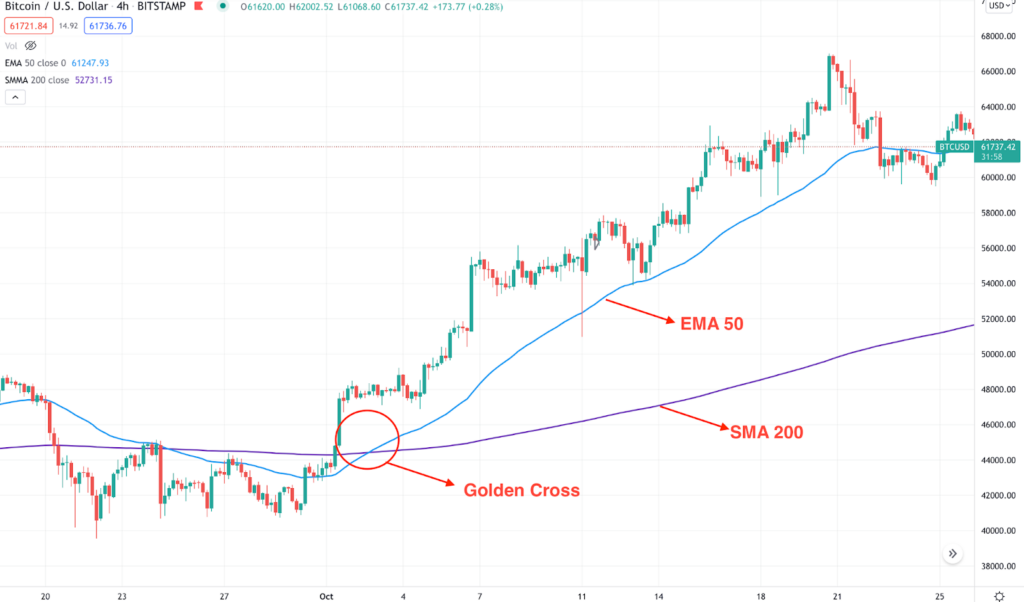
A trading signal is generated whenever the crossover of the two EMA occurs. Whenever the 50EMA crosses the 200EMA from below and moves up, it implies a buildup in buying pressure and hints of an uptrend in play. Conversely, a trader can use this opportunity to enter a buy position.
A sell signal would come into play whenever the 50EMA crosses the 200EMA and moves lower, signaling the formation of a downtrend. The crossover implies increased bearishness. Technical traders use this opportunity to eye-sell positions as price tends to move lower most of the time.
Using the Relative Strength Index
The Relative Strength Index is a momentum indicator that highlights the prevailing market conditions. It comes with readings of between 1 and 100. Whenever its reading is above 50, a cryptocurrency is considered bullish and likely to continue registering higher highs. Whenever the reading is below 50, it implies market bearishness, signaling price is likely to continue tanking.
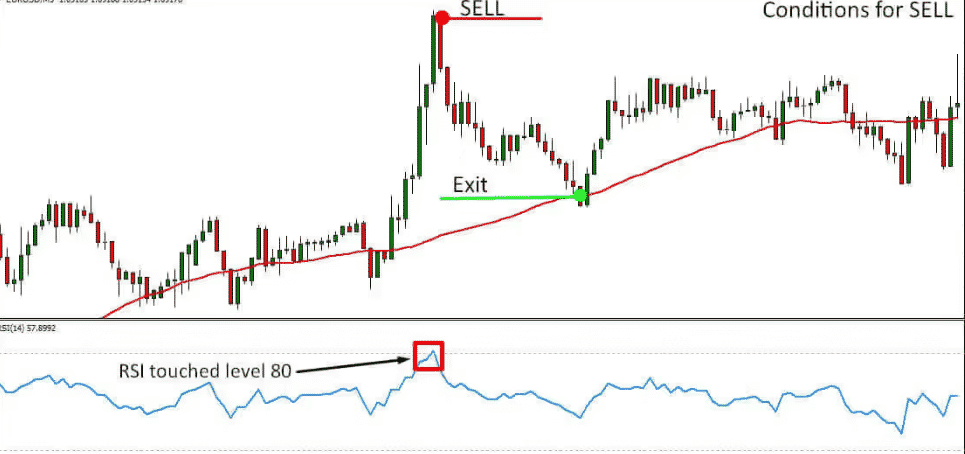
While using the RSI, the 30 and 70 levels are of great importance. A cryptocurrency is considered overbought whenever the RSI reading is above 70. What this means is that an asset has been bought too much. The likelihood of price reversing direction and moving lower is usually high as smart money refrain from buying at highs.
Similarly, a cryptocurrency is considered oversold whenever the RSI reading is below 30. What this means is that the cryptocurrency has been sold too much, and that price has tanked significantly. The prospect of price reversing direction and moving up is usually high as no one is looking to sell at the prevailing lows.
RSI divergence
Divergence occurs whenever the RSI and price are moving in the opposite direction, acting as a warning sign of a potential price reversal. Whenever the RSI moves up, making higher highs, but the price continues moving lower, it implies waning short-selling pressure affirming bullish divergence. In most cases, the price will reverse direction and start moving up in line with the RSI.
Likewise, whenever the RSI moves lower, making lower lows, but the price continues moving up, it is a warning sign of a potential price reversal. This means that the upward momentum is waning and that price is likely to correct and start moving lower, affirming bearish divergence.
EMA and RSI trading strategy
The RSI and the EMA should always be used in combination for the best outcomes while trading cryptocurrencies. In this case, the RSI would be used to outline the prevailing market condition, either overbought or oversold. In return, the EMA would be used to confirm the prevailing market trend and the ideal level to enter a long or a short position.
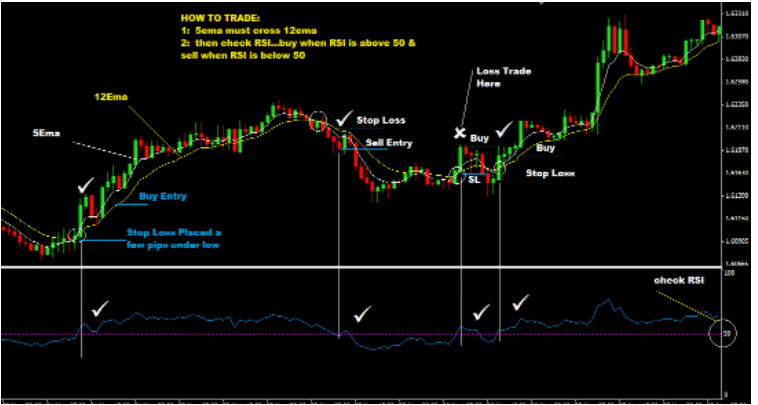
A trader should look to trigger a buy position when the RSI reading is below 30, signaling an overbought condition as the prospect of price bouncing back is usually high. However, the Buy signal is only confirmed on price moving above an EMA such as 50EMA, firming a buildup in buying pressure. The buy signal could also be confirmed on the 50EMA moving above the 200EMA.
One can also look to open a short position on the RSI reading, moving above the 70 level, implying an overbought market condition. The sell signal would be confirmed on the 50EMA crossing the 200EMA and edging lower, affirming bearish momentum and a downtrend formation.