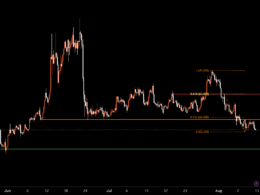
The recent decline in Apple Inc.’s stock on Friday has caught the attention of chart watchers who are labeling it as a breakdown. This selloff confirms the break of a trendline, which has played a central role in the stock’s rally since the beginning of the year.
“The trend is your friend” is a well-known and widely accepted trading principle on Wall Street. However, an important addendum to this axiom states that the trend is your friend, “until it’s not.”
Drawing a trendline is perhaps the easiest and most effective way to identify a trend. It’s important to note that while two points can create a line, it takes a third point to validate a trendline. The more points on the line, the stronger and clearer the trend, and subsequently, the more significant the breakdown.
In the case of Apple’s stock chart (AAPL), there is a clearly defined uptrend line that originated from the stock’s 19-month intraday low on January 3rd. It then connects with several subsequent lows along the way.
Earlier this week, ahead of Apple’s fiscal third-quarter earnings report released late Thursday, the stock slipped below this trendline. However, this alone was not sufficient to confirm a definitive break in such a well-established trend.
According to one of the six principles of the century-old Dow Theory of market analysis, a trend should be assumed to be in effect until there is a definite signal indicating its reversal.
With Apple’s stock declining by 3.6% in afternoon trading on Friday after the earnings report, the breakdown appears to be quite confirmed.
Also read: Don’t Dismiss the Dow Theory Because of Its Age
Don’t Miss: Apple’s Stock and its Potential Slowdown
As Apple’s slowdown continues, experts are questioning whether the iPhone alone is enough to sustain its stock price. Technical analyst Katie Stockton from Fairlead Strategies LLC has highlighted the importance of monitoring how the stock performs in relation to the 50-day moving average. This short-term trend tracker could potentially provide support for the stock.
Currently, the stock is trading slightly below the 50-day moving average, which is around $187 as of Friday. Wall Street professionals who follow the Fibonacci ratio of 1.618, also known as the “golden” or “divine” ratio due to its prevalence in natural systems, are eagerly observing the next downside level around $169. This level represents a 38.2% retracement of the rally from the January 5 closing low of $125.02 to the July 31 record close of $196.45.
If the stock were to decline further, other key Fibonacci levels to watch would be approximately $161 (50% retracement) and $152 (61.8% retracement). Many traders and investors believe that if a retracement remains within 61.8% of the prior trend, the prior trend is likely to continue.
It is noteworthy that Apple’s stock has performed exceptionally well this year, with a remarkable 41.9% increase since the beginning of the year. In comparison, the technology-heavy Nasdaq-100 Index has climbed 40.9%, and the Dow Jones Industrial Average has seen a more modest gain of 6.5%.


